
Debug your TSP Scripts with TSP Toolkit
Semiconductor manufacturers, validation engineers and reliability engineers can now quickly debug scripts and identify errors within automated tests developed for TSP-enabled Tektronix instrumentation such as SMUs, DAQs or DMMs with the Tektronix TSP Toolkit, a Visual Studio Code extension for use with the TSP Toolkit script development environment. This extension adds powerful new tools to debug and generate scripts, accelerating the automation process.
In this blog, we’ll explore the new script debugging feature added to TSP Toolkit and how to use it to refine your test scripts.
Why Debug Scripts?
When it comes to test automation, interruptions during script execution can have a big impact on test throughput. Script run-time errors can be caused by a variety of factors, such as coding mistakes, changes to the application, or even the current state of the instrumentation. Quickly diagnosing these errors by debugging scripts simplifies script maintenance and minimizes downtime.
A debugger suspends script execution within the runtime environment, pausing the script at a breakpoint so that the user can manually step through code line by line to determine where an error may be thrown.
Tektronix TSP-enabled instrumentation has a built-in “test script processor” (TSP) which allows scripts to be run directly on the instrument without communicating with a PC. The TSP Toolkit Visual Studio Code extension now includes an “on-instrument debugger” feature that allows users to debug TSP scripts while they run in the instrument’s runtime environment.
Refine your Test Scripts with TSP Toolkit
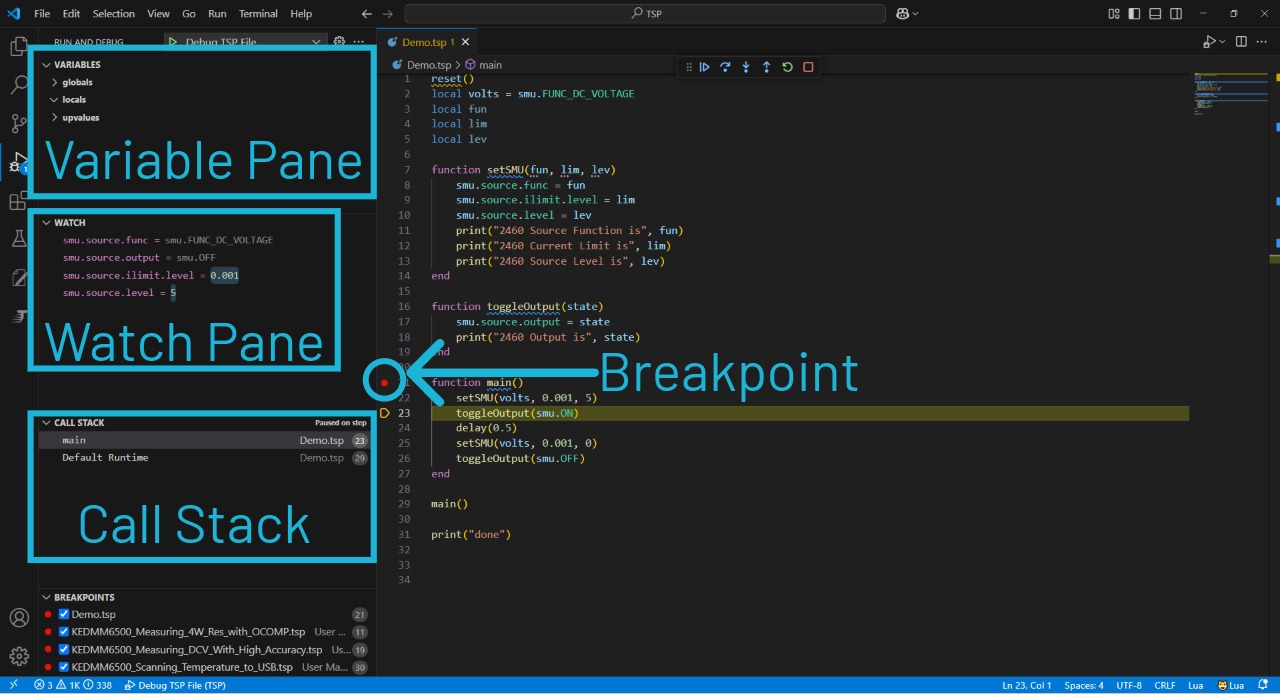
The new TSP Toolkit on-instrument debugger includes several features that will help users refine their TSP scripts.
The Variable Pane allows you to monitor the status of variables declared in the script and edit the stored values dynamically.
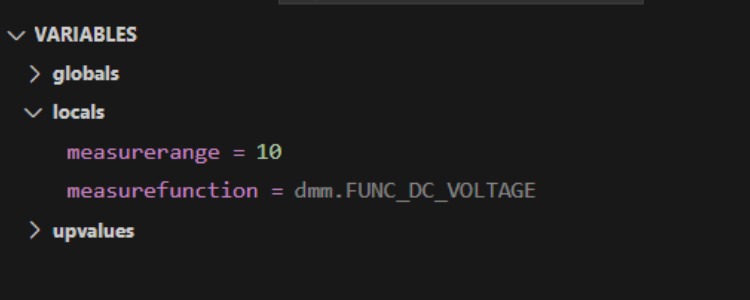
Figure 1: The TSP Toolkit On-Instrument Debugger Variable Pane
The Watch Pane allows you to monitor the status of any selected variables, TSP commands, data tables, and expressions as the debugger steps through the code.
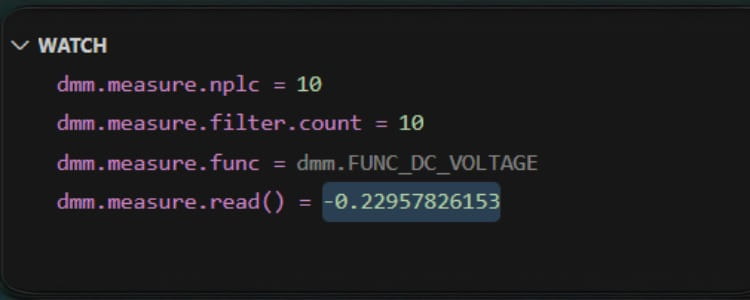
Figure 2: The TSP Toolkit On-Instrument Debugger Watch Pane
The call stack lets you view the function or procedure calls that are currently on the stack and shows all functions that have been called up to the point where an exception has occurred.
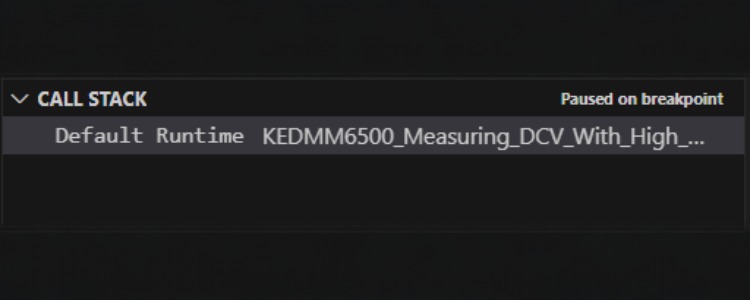
Figure 3: The TSP Toolkit On-Instrument Debugger Call Stack
These features increase productivity and assist users in building test scripts that are robust and reliable by enabling them to diagnose errors, troubleshoot programming mistakes, and refine their code