Ending up with a radiated emissions failure is easy. It happens to most of us at some point. What comes next is trickier – where is it coming from? Using a near-field probe to look for unwanted emissions, probing signals with a mixed domain scope, and correlating those results are VERY effective in identifying the source of emissions. I like to call this approach “sniff and browse.”
If your device has failed a radiated emissions test, you generally know the frequency of the offending emissions. If you know it’s an obvious clock frequency, SMPS frequency, or a harmonic of one or the other, then you at least you have a place start.
But if the source isn’t so obvious what do you do? This is where “sniff and browse” comes in.

Using an H-field probe connected to the spectrum analyzer input to “sniff” around on a printed circuit assembly.
The “sniffing” part involves using a near-field probe connected to the spectrum analyzer input of an MDO4000C mixed domain oscilloscope. You use the near-field probe to sniff around your board, isolating the area of the board that is has the highest amplitude around the same frequency of the EMI failure. The “browse” part of the process uses conventional 10X probes connected to the oscilloscope inputs. You browse around your board, searching for signals that correlate to the amplitude signature emissions. Then you use the MDO4000C’s combined view of the near-field sniffing and signal browsing to correlate the two. This is a technique where you correlate the time domain waveform, the spectrum waveform, and sometimes the RF amplitude versus time waveform all at same time.
Synchronizing near-field probe signals with on-board signals
The synchronized display of the MDO4000C is key to being able to correlate the near-field sniffing with signal browsing. It lets you plot several types of information on one display:
- Voltage vs. time (conventional analog oscilloscope waveforms)
- Digital value vs. time (logic analyzer waveforms)
- Serial bus information (protocol)
- RF amplitude over time
- Spectrum, time-aligned with the signals above

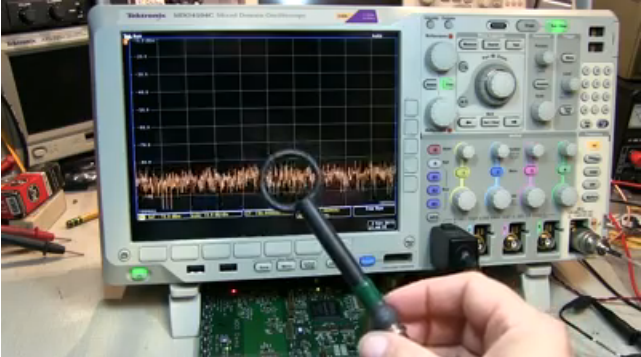
Looking at the spectrum of emissions picked up by an H-field probe at a specific point in a digital waveform.
Using this display, you can easily correlate your sniffing with the near-field probe and browsing with a scope probe. Rather than try to describe the process in words, I encourage you to watch this new video, “How to Locate Sources of Emissions for EMI Troubleshooting.” Although it doesn’t use my sophisticated sniff and browse terminology, it does a great job of describing the technique in less than five minutes. You’ll also want to read through the application note “Practical EMI Troubleshooting” for a more detailed description.
Finding the source of unwanted emissions is an important part of EMI troubleshooting. Characterizing the RF portion with a near-field probe, browsing signals with scope probes, and correlating the two on an MDO4000C Tektronix mixed domain oscilloscope is a great way to get to the source of the problem.