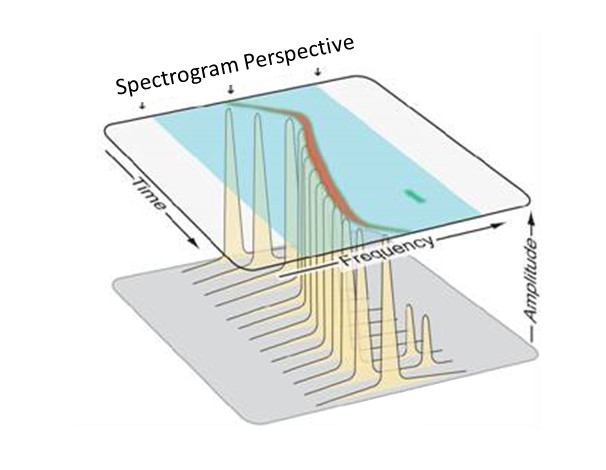
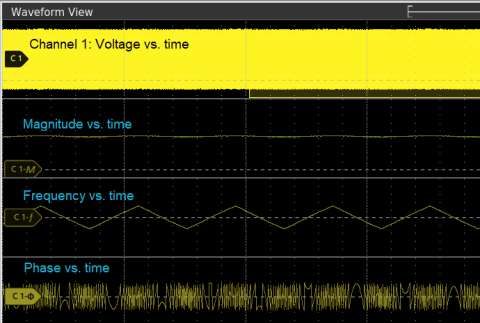
What is a Spectrogram?
A spectrogram is a graphic that shows the viewer how the frequency domain content (spectral content) of a signal or signals is changing or progressing over time. It consists of a collection of spectrum traces that are collected/processed over time and stacked next to each other, much like slices of bread in a loaf. While each individual spectrum trace would be on the “butter …
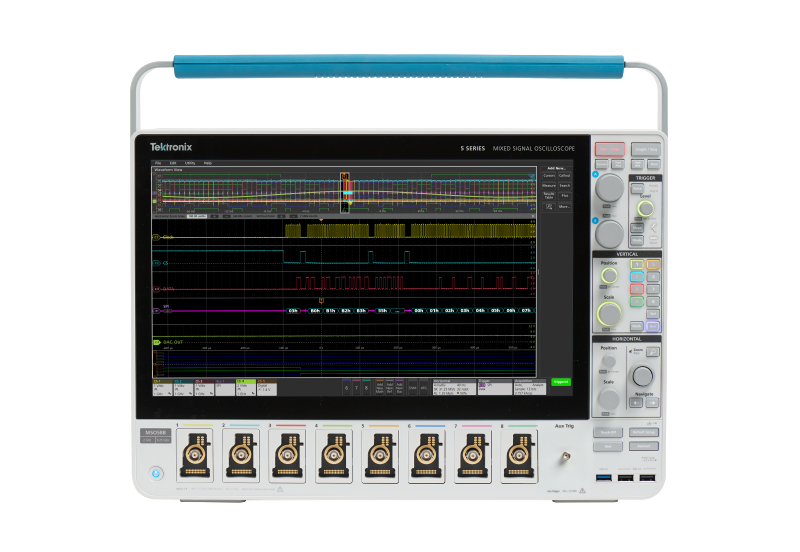
Customer-Driven Improvements in the New 5 Series B MSO Deliver an Even Better User Experience and More Capabilities
Oscilloscopes are among the most important tools in the electronics industry. So, it’s not surprising that the choice of a specific oscilloscope by an engineer can be a deeply personal matter. And engineers, by their nature, are full of ideas for improvement. Since the release of …
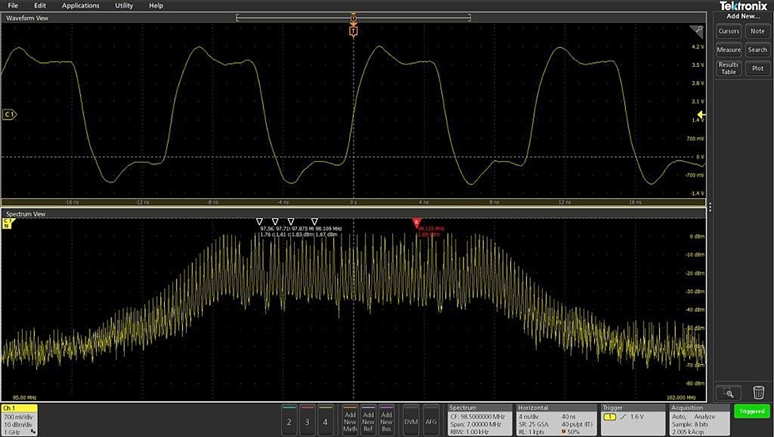
Efficient system analysis and debug relies on insights but correlating signals across multiple domains has traditionally been a painful, technically challenging process. It can be difficult to figure out why a system isn’t working as expected without precise, synchronized insight into both time and frequency domains.
Spectrum View was created to solve that challenge. The 4, 5 and 6 Series MSO …
Analyzing Signals Across Multiple Domains
There is increasing interference in the RF domain as we work to make IoT devices more powerful, consume less energy and have longer battery lives but still broadcast high-quality RF communication. From smart watches to heart rate sensors, the devices being designed today are getting smaller and smaller, which makes signal integrity more important than ever …
In a few short years, the number of drones, or unmanned aerial vehicles (UAVs), purchased has soared. In the US alone, the FAA projects the small model hobbyist UAV fleet will more than double from an estimated 1.1 million vehicles in 2017 to 2.4 million units by 2022. Worldwide, Teal Group’s World Civil UAS Market Profile and Forecast projected in 2018 that non-military UAS production (Commercial …
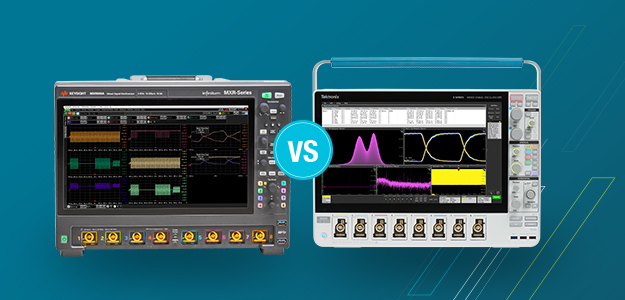
The Tektronix 5 Series MSO really changed the professional oscilloscope playing field with its large high-definition display, 6 and 8 channel models paired with an intuitive user interface that was designed from the ground up to incorporate touch interactions (pinch zoom, double tap, etc). The 6 Series incorporated these same features with higher bandwidth and improved performance.
Keysight …
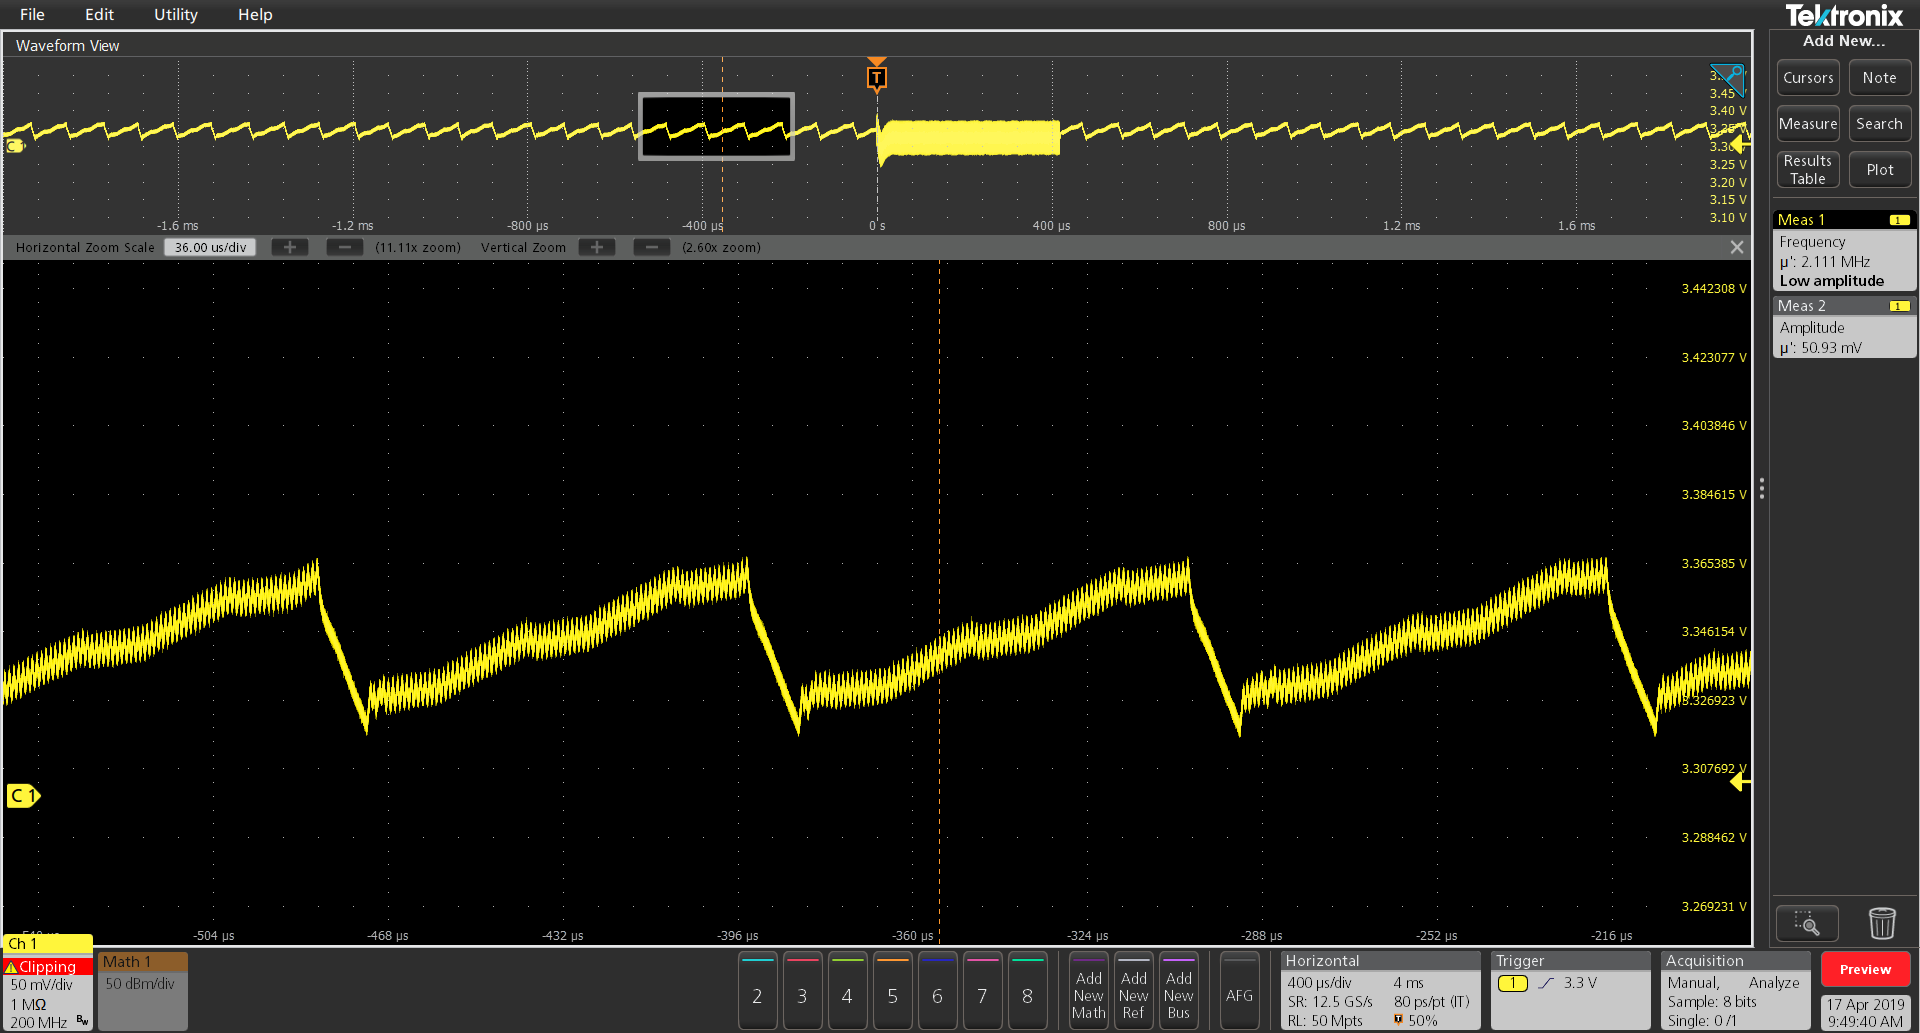
Debugging embedded systems often involves looking for clues that are hard to discover just by looking at one domain at a time. The ability to look at time and frequency domains simultaneously can offer important insights. Mixed-domain analysis is especially useful for answering questions such as:
What’s going on with my power rail voltage when I’m transmitting wireless data?
Where are …
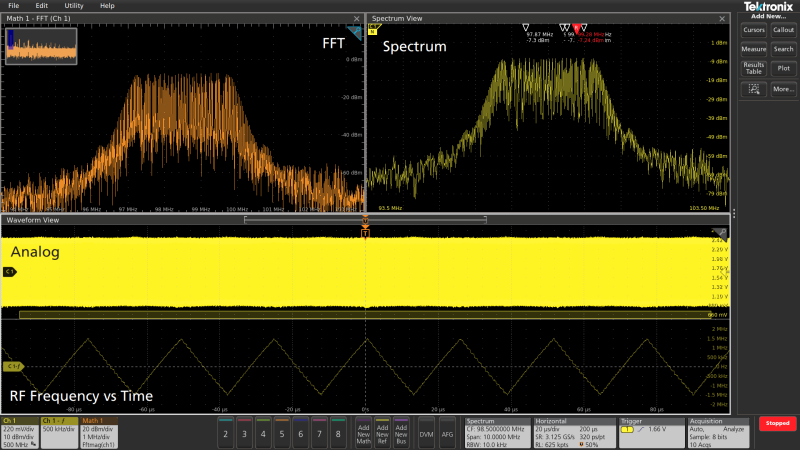
How Spectrum View Outperforms Traditional Oscilloscope FFTs with Tighter Frequency Resolution Over Wider Ranges
Debugging embedded systems often involves looking for clues that are hard to discover just by looking at one domain at a time. The ability to view time and frequency domains simultaneously can enable you to measure a power rail’s voltage during wireless transmissions or observe nearfield …
Several months back, we added a new kind of frequency analysis capability called “Spectrum View” to our 5 and 6 Series Mixed Signal Oscilloscopes. I posted a two-part article called “A New Approach to Frequency Analysis on Oscilloscopes” Part 1 and Part 2, explaining the differences between this approach and run-of-the-mill oscilloscope FFTs. Since then a couple of things have happened.
Tek …
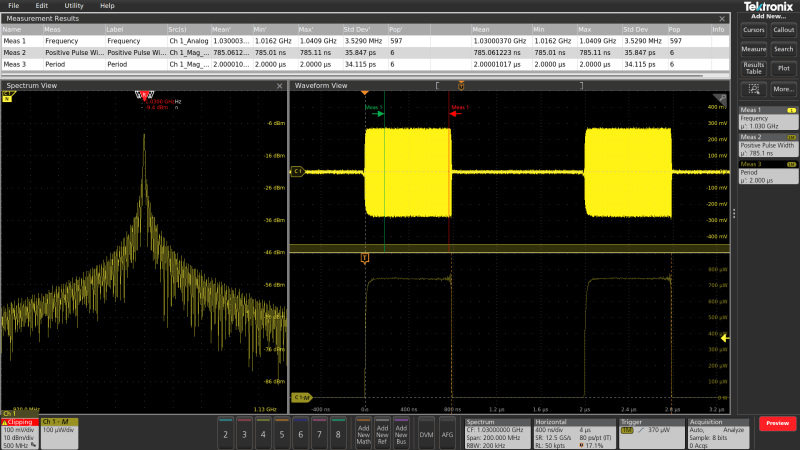
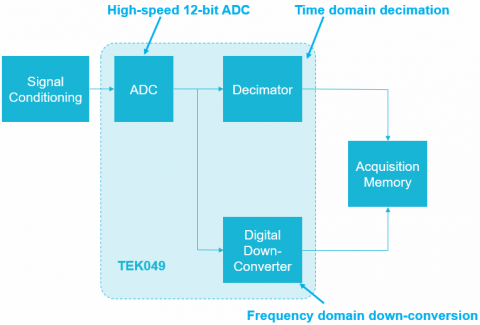
As discussed in Part 1 of this blog series, the ability to perform spectral analysis on an oscilloscope is limited due to the inherent tradeoffs of FFTs. Overcoming these tradeoffs was a key design goal for Spectrum View. This new capability was made available on 5 and 6 Series MSOs with a recently released firmware upgrade.
To understand how Spectrum View works, it is important to note that …