Introduction
Microphonic and phase-hit problems have a well-deserved reputation for disrupting development programs and stopping production lines. Many of today's modern communications systems have become very sensitive to these unintentional, internally generated sources of modulation. Compounding the problem, the intermittent nature of these disturbances has traditionally made obtaining a positive diagnosis of the cause both difficult and time consuming. The Real-Time Spectrum Analyzer (RTSA) has a unique ability to trigger and capture these elusive events for analysis, greatly reducing the time necessary to resolve the problem. Likely sources of microphonic and phase-hit problems are reviewed, with suggestions on how to identify them and characterize the components that cause them using the RTSA.
In this application note, we begin with a brief overview of the RTSA's extraordinary capabilities and an introduction to the microphonic and phase-hit problems in communications systems. We will review common causes of microphonic sensitivity, and then provide a similar review of phase-hit sources. Next, we will show how the RTSA can reliably capture these events. Finally, we will examine several methods of stimulating and characterizing the disturbances to allow the communications systems engineer to specify the required component performance to the vendors.
RTSA Overview
The RTSA is designed to address the measurement challenges associated with dynamic RF signals. The fundamental concept of real-time spectrum analysis is the ability to trigger in real-time on an RF signal spectrum, seamlessly capture it into memory, and analyze it in multiple domains. This makes it possible to reliably detect and characterize RF signals that change over time, such as microphonic and phase-hit events.
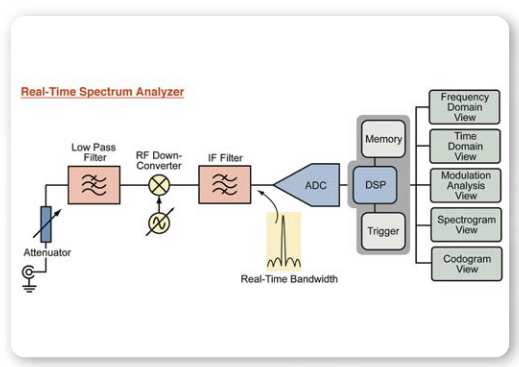
The RSA3408A's RF front-end can be tuned from DC to 8 GHz to down convert the input to a fixed IF. The signal is then filtered and digitized by the Analog to Digital Converter (ADC) at a rate fast enough to support 36 MHz of bandwidth. The signal is then passed to the Digital Signal Processing (DSP) engine that manages the instrument's triggering, memory, and analysis functions. The RTSA is optimized to deliver real-time triggering, seamless signal capture, and time-correlated multi-domain analysis. In addition, advancements in ADC technology allow the RTSA to make traditional frequency domain measurements that equal or surpass the basic RF performance of many swept spectrum analyzers.
The RTSA is ideal for rapidly solving microphonic and phase-hit problems. Let's review why microphonic and phase-hit problems can be so troublesome to better understand how the RTSA represents a unique reliable solution to these problems.
The Ominous Problem
Why are microphonics and phase-hits such dreaded system problems?
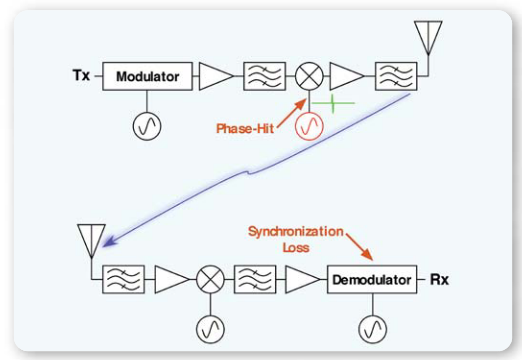
In communications systems, microphonics and phase-hit events typically cause a momentary loss of carrier and symbol synchronization. Loss of synchronization results in large bursts of data errors that can well exceed the present state of the art in Forward Error Correction (FEC). This means that for a short period-of-time until the event subsides and resynchronization occurs, communications may be totally lost. If the traffic being carried over the communications link is of high value, such large bursts of errors or losses of communications may be unacceptable.
Intermittent events can be devastating for many communications applications. For example, it can be very costly when a 155 Mbps point-to-point microwave link carrying 2000+ cell phone calls back to the central office switch loses synchronization from a microphonic event. Even a brief microphonic event lasting for a few hundred milliseconds can have a ripple effect in complex telecom systems. Loss of radio carrier synchronization means important timing information that is transmitted through the RF link to synchronize multiplexers and network management systems is also lost. Since many of those devices operate at lower speeds, the time to serially resynchronize down stream equipment can be substantially longer than the resynchronization of the RF carrier, to say nothing of the time it takes callers to redial and resume their conversation. Dropping that amount of toll-paying traffic for a few minutes while the system resynchronizes is unacceptable.
Similarly, continuous unwanted modulation from microphonic pickup can have serious consequences too. An airborne radio surveillance post trying to resolve precise direction to an enemy aircraft cannot tolerate any microphonic induced phase noise on its crystal oscillators lessening the resolution accuracy of the bearing angle to the target.
The mechanisms for microphonics and phase-hits, from an engineering perspective, are virtually never drawn on a schematic diagram. These unwanted component responses are often ignored until final product testing begins, or worse yet they are discovered after field deployment. When they are finally diagnosed and recognized, the solutions to these problems can be difficult and time consuming to implement. The experienced program manager or chief system architect will often go to great lengths and expense to avoid components that are capable of causing microphonics or phase-hits.
Much of the aversion to using components that can be microphonic or create phase-hits comes from the difficulty in actually diagnosing them. Imagine the challenges in diagnosing a phase-hit, if that phase-hit occurs once every week for about 150 ms. Likewise, the problems such interruptions can cause in radio control of large electric utility generators, switching substations and unmanned rockets have the potential to create unthinkable disasters. Similarly, the value of traffic carried over many telecommunications links can be extremely high. Million dollar a minute sports event broadcasts, thousands of toll paying phone calls multiplexed over the same radio link and critical national security links can't afford to be taken off the air by the occasional phase-hit. Trying to capture such a rare event and determine its cause could take the microwave communications engineer many months to gather enough data to make a reliable diagnosis.
This can leave the engineer and radio manufacturer in the embarrassing position of trying to fix a problem without the clear diagnostic information, subjecting the engineer to time consuming trial and error testing, with a week's delay between tests! It's no wonder that microphonic and phasehit problems typically take months to diagnose and resolve with traditional test equipment.
Example Scenarios
Let's look at some actual scenarios where microphonics and phase-hits have been a serious problem.
Our first example takes place when the afternoon freight train rolls by and big problems start. Many utilities and railroads often use point-to-point microwave radios to control the flow of their products or transportation services. Since they own the 'right of way' that their pipeline, power line or railroad travels over, this makes a convenient place to locate a microwave link. In the case of the railroad industry, placing a microwave radio link just a few feet from the tracks is a common practice. When the afternoon freight train rolls by, the ground vibration just a few feet from the tracks can be large enough to cause the microwave radio to lose synchronization from microphonic pickup. The loss of synchronization causes the radio to switch to a 'hot' standby. Unfortunately, since that radio is also undergoing carrier synchronization loss, because it is located right next to the first radio, the link goes down completely. Since the microwave links carry important information about the location and speed of the railroad's trains, a little microphonic component can stop an entire freight and transportation system.
Missiles and rockets are known for their very high vibration. Designing for these harsh environments can restrict engineers to only the most robust components. Occasionally mission requirements can demand placing components that are susceptible to microphonic pickup such as Yttrium Iron Garnet (YIG) resonators on board. One such decision to take advantage of the unique magnetic tune-ability of the YIG resonator prevented a major project from taking off for many months. Special electro-mechanical solutions to the microphonics problems had to be developed. Many, many engineering hours were required to design and test microphonic suppression methods, sending the project far over budget.
Another example where phase-hits can have a devastating effect on a business is the telecom infrastructure radio. Telecom providers, like most utilities, often require very high Availability of Service (AoS) of their infrastructure radio assets, along with very high Quality of Service (QoS). AoS is commonly measured in seconds of outage per year of operation! QoS standards often demand Bit Error Rates (BER) of less than one bit error in every 1012 sent (BER = 10-12). Said another way, the typical 45 Million bit per second (Mbps) digital radio link could make 1,419 errors per year. To put this in perspective, a single 10 ms error burst from a phase-hit disturbing carrier synchronization would create an error burst of 22,500 bit errors, or 16 years worth of bit errors! Manufacturers of this type of microwave data link are keenly aware of these requirements and temperature cycle these products to ensure they are free of phase-hit errors.
On occasion, a microwave phase locked synthesizer will creak with temperature fluctuations, and product shipments must stop until the problem can be isolated and corrected. Unfortunately, telecom infrastructure equipment is often large enough that it takes hours to temperature cycle from hot to cold. This means the engineer might only get a single phase-hit observation every day. If it takes ten to twenty observations to isolate the cause of the phase-hit in the radio system, diagnosis could require the better part of a month! Repair and validation of the fix could take substantially longer. This can have disastrous consequences for the production operation as millions of dollars of product accumulate while engineers frantically search for the cause of the phase-hits.
The RTSA offers a unique means to capture these events and characterize them in ways no other analyzer can. This can greatly speed the diagnostic process. Before proceeding to look at some of the more common causes for microphonic and phase-hit problems, let us briefly look at what is meant by the terms microphonic and phase-hit.
Definition of Microphonics and Phase Hits
The terms microphonic and phase-hit are often used interchangeably in casual technical conversations. A microphonic event might be said to 'cause a modulation phase-hit.' In this application note, we shall use a more precise definition for each term to denote different physical mechanisms. Microphonics are acceleration-induced electrical responses that come from what is usually an auditory vibration or sound pressure wave stimulus. In effect, microphonics are the undesirable behavior of microwave components acting like a transducer. Phase-hits are those physical phenomena that do not directly come from acceleration related responses. Phase-hits usually arise from temperature related effects.

Our purpose for using a more precise definition for these terms is to help separate the physical phenomena and diagnostics necessary to isolate the problem. Microphonic events are generally repeatable and can be stimulated in a consistent manner once discovered. Phase-hits, on the other hand, can be very difficult to consistently stimulate. Much like the creaks and cracks of an automobile radiator cooling off, phase-hits often occur in a seemingly random pattern. Phase-hits are also predominantly temperature related.
RF Microphonic Sensitivity
A variety of physical phenomena can cause microphonic behavior in components. The result is often unwanted modulation on Local Oscillators (LO's) that disrupts receiver synchronization.
We shall review some of the most common mechanisms of microphonic sensitivity
Electrical Length and Mechanical Modulation
High frequency microwave components are often susceptible to mechanical modulation of the electrical wavelength. This can create a microphonic sensitivity if the amount of mechanical movement becomes significant relative to the electrical wavelength. In effect, the mechanical movement can retune microwave circuits. As electrical length shortens, mechanical stability becomes more critical.
At X-band (≈10 GHz) even a few thousandths of an inch displacement can cause noticeable modulation of a low phase noise LO. In a high vibration environment such as a missile or rocket, microwave cavities must be kept rigid to prevent microphonic modulation by physical deformation of the components. Inexpensive flexible sheet metal structures must be replaced with rigidly machined parts to suppress microphonics.
Direct mechanical modulation of electrical length is usually found to be a problem only in extreme vibration environments. In the next section, we shall explore one of the most common microphonic mechanisms, strain on a crystal lattice creating piezoelectric voltages and modulating permittivity.
Crystal Lattices, Permittivity and Loose Atoms
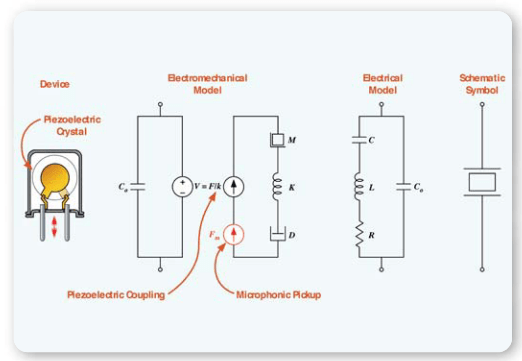
A crystal is a regular ordering of the elements that make up a material's solid state. This ordered arrangement of elements is called a lattice. Many materials that form crystal lattices exhibit the piezoelectric property, where mechanical stress on the lattice will induce a voltage on the crystal and vice versa. The piezoelectric voltage arises because slight displacements of the regularly ordered crystal lattice alter the position of the electrons trapped in the lattice. As the electron's position changes, so does the charge potential across the crystal.
The piezoelectric effect is widely used in electronic devices such as quartz crystal oscillators, where the mechanical vibration resonance of the crystal is used as a high Quality (Q) resonator element. Unfortunately, crystal oscillator resonators are also susceptible to external vibrations, making them microphonic. Crystal manufacturers attempt to minimize this susceptibility to external vibrations to reduce the microphonic pickup of the resonator. The microphonic susceptibility can be greatly reduced, but never completely eliminated.
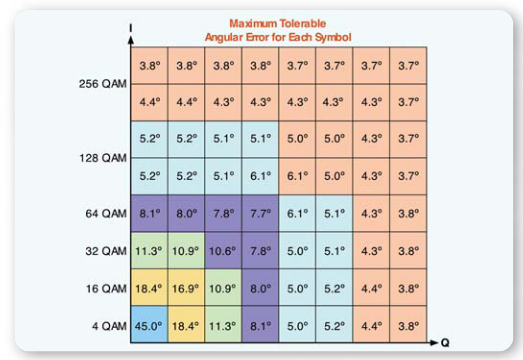
A 256 QAM system can tolerate only 3.7º of total phase error before making symbol errors, and applications of complex modulations such as 256 QAM that are exposed to high vibration, frequently encounter microphonic problems with their crystal oscillators.
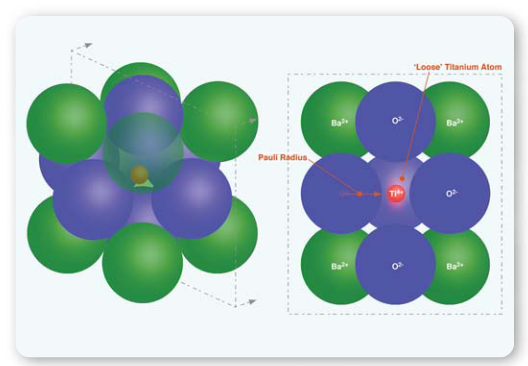
Similar to the piezoelectric effect, some ceramic materials exhibit the ferroelectric effect that can make them susceptible to microphonics. The Pauli radius, the distance the electron can be found from the center of the atom, defines the atomic size. In a lattice arrangement, the atoms configure themselves in orderly arrangements based on their size and charge.
Some ceramic compounds have an element that is very small and fits between the larger Pauli radii of the other atoms. This smaller atom is effectively 'loose' between the larger atoms, and gives rise to an electric charge that is free to move a slight amount creating an electric dipole moment. This in turn gives rise to the ferroelectric effect, the spontaneous alignment of electric dipoles within the material, and is analogous to magnetic domain alignment in ferromagnetic materials.
Materials that exhibit this ferroelectric effect have strong electric dipole characteristics and, consequently, very high permittivity. The high permittivity of these materials makes them ideally suited for making small capacitors, high dielectric resonators or small ceramic comb-line filters. Ferroelectrics are widely used in the radio and electronic industry. Unfortunately, these materials change their properties when placed under mechanical stress. Ferroelectric materials change their permittivity or dielectric constant when subjected to mechanical forces. Ferroelectric materials also exhibit the piezoelectric effect as the trapped charge moves with lattice deformation. The changing dielectric constant with lattice stress or acoustic vibration and piezoelectric effect makes components built with ferroelectric materials susceptible to microphonics.
High Q ceramic dielectric resonators used at microwave frequencies are often made with ferroelectric materials to minimize their size with the high dielectric constant. Adequate microphonic isolation becomes essential when using these materials to avoid unintentional modulation of the LO signals they produce.
Magnetic Drums
Another common microphonic source is the YIG resonator. YIG resonators have the ability to tune over a very wide range with a high Q. These properties make the YIG resonator very desirable for receivers that require wide tuning ranges and low phase noise.
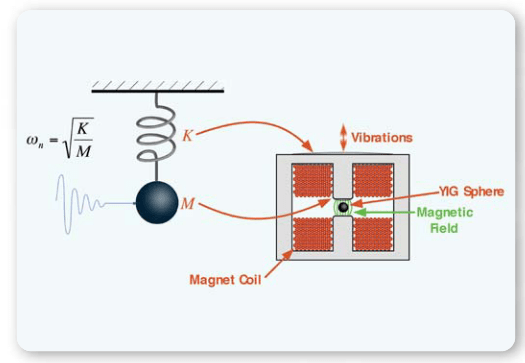
The YIG source is typically configured in a cylindrical shape with magnetic pole pieces in the center of the cylinder. This allows the magnetic circuit necessary to bias the YIG sphere at the center of the component to be completely shielded from external magnetic fields. Shielding is important because the YIG resonant frequency is very dependent on the magnetic field. The cylindrical shape of the component can act like a drum to vibration. When a mechanical impulse is imparted to the structure, the surface will vibrate on a microscopic scale. In turn, the gap between the pole pieces modulates the magnetic field that biases the YIG sphere to a particular resonant frequency. This unintentional modulation of the magnetic field makes the YIG source very microphonic.
The mechanical vibrations resonant period in the magnetic structure depends on the modulus of elasticity (Young's Modulus) of the vibrating surface and the mass it is loaded with. Analogous to a Mass (M) suspended from a spring with a force constant (K), if the mass is displaced from its rest position it will oscillate up and down in a damped sinusoidal manner. Similarly, if the YIG source is tapped, the mechanical impulse will cause the pole pieces to move in a damped sinusoidal fashion.
Electrically, the damped sinusoidal movement of the pole piece causes the frequency of the YIG source to change in a like manner.
By altering both the stiffness of the material and the mass of the pole piece, the natural frequencies found in the ringing down response can be controlled, but not eliminated. Shock mounting the YIG source can reduce the mechanical energy available to excite the natural resonate frequencies of the component, thereby reducing the susceptibility to microphonic pickup.
In extreme environments, special YIG devices with a nonmagnetic material placed in the pole piece gap next to the YIG sphere have been used with some success to help eliminate the vibration of the pole pieces. Unfortunately, magnetostriction, or the permeability change with mechanical stress, limits the desensitization possible by physically 'pinning' the gap.
The key to using YIG components in applications that may be sensitive to microphonics is to carefully characterize their susceptibility to mechanical vibrations and avoid stimulating the natural vibration modes of the part. Later in this application note, we shall review how to properly characterize these parts.
The Phase-Hit Phenomena
Phase-hits can also cause receiver synchronization problems, but the mechanisms are different from those found in microphonic components. Phase-hits can be more challenging than microphonics because, unlike microphonics that are easily stimulated, phase-hits can be difficult to reproduce consistently. Much like predicting earthquakes, phase-hits occur without warning and can be elusive or impossible to capture on the ordinary signal analyzer. The RTSA offers a unique ability to trigger, capture and analyze these troublesome events.
Let's review some common causes of phase-hits, before we see how to apply the RTSA to diagnose the source of these events.
Coefficient of Thermal Expansion Mismatches
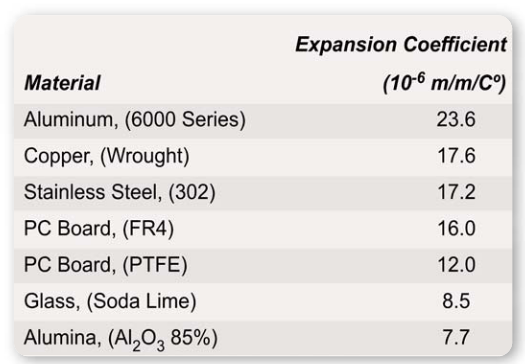
The Coefficient of Thermal Expansion (CTE) also referred to, as the Thermal or Temperature coefficient of expansion (Tce), is an important material property when it comes to avoiding phase-hit problems. When most materials are heated, they expand (water being one exception, since it expands when it is cooled). When building microwave equipment, we rely on the mechanical stability of the components and grounding in the radio system. If we use materials with different CTEs, the mismatch can build up large mechanical stresses inside the radio. If that energy is released suddenly, at a critical point in the radio's circuitry, it can result in a phase-hit or an abrupt change in the phase of the signal.
Looking at some of the common materials used in fabricating a radio product, it is easy to see that there are many possible ways to create thermal expansion mismatches. Even small expansion coefficient mismatches can create tremendous forces. Consider the force necessary to burst a steel water pipe when water freezes inside.
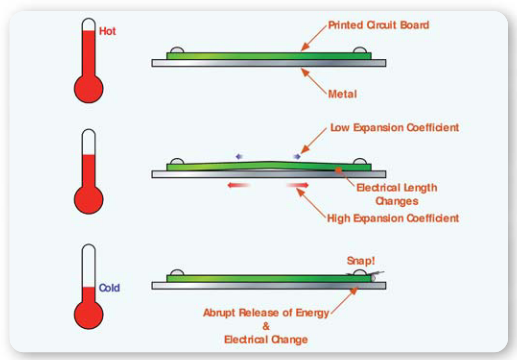
A common thermal mismatch problem arises when a printed circuit board is attached to a chassis housing. The expansion coefficient of the circuit board is frequently different from that of the chassis. This can cause the circuit board to be stretched and compressed as the equipment is heated and cooled. If the equipment is used outdoors or in harsh outer space environments, the temperature fluctuations between hot and cold can be great. Such environments can cause buckling that changes the grounding paths and electrical lengths. The stresses can also be released suddenly as slippage abruptly occurs. Similar to the creaks and cracks of an automobile engine cooling, the release of energy stored up in the mismatch of expansion coefficients is usually abrupt.
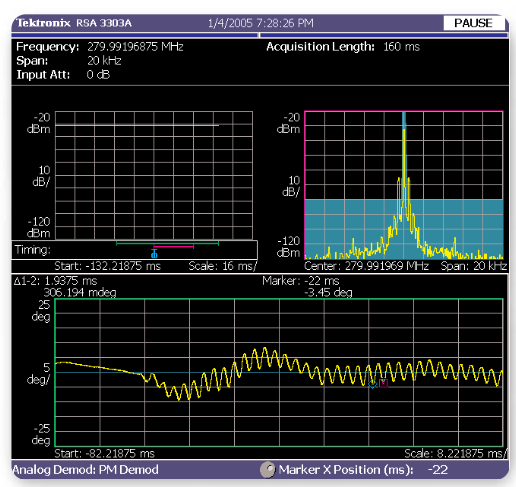
The sudden mechanical change can create a jump in phase of the RF signal. Phase-hits tend to have a more impulselooking characteristic that is typically shorter in duration than microphonic disturbances, which usually resemble a damped sinusoid. This is an important clue in diagnosing which mechanism was responsible for creating a loss of synchronization.
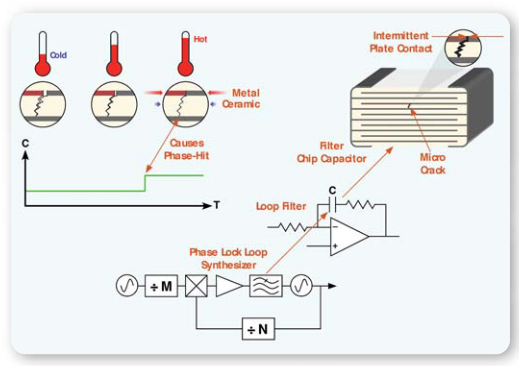
Coefficient of thermal expansion mismatches can also create problems in multi-layer ceramic capacitors. To maximize capacitance in a small area, some ceramic capacitors use a very fine multi-layers design. The metal and ceramic materials have different expansion coefficients and can create internal stress in the part. If handled improperly, the capacitor can develop micro-cracks that cause portions of the internal plate structure to work intermittently.
If a capacitor with a micro-crack is used as part of the loop filter in a Phase Lock Loop (PLL) integrator circuit, the capacitance value can change abruptly. To the phase lock loop, an abrupt change in capacitance will cause an abrupt shift in phase of the output oscillator. Phase steps greater than 90º or 180º can cause a momentary loss of lock as the phase detectors go non-linear.
Unfortunately, most carrier recovery loops or algorithms tend not to be as robust as the PLL's used to synthesize LO frequencies. So when an LO synthesizer creates a phase-hit, it usually causes an even greater disruption to the carrier or symbol recovery loops.
To avoid developing micro-cracks, careful handling of ceramic multi-layer capacitors used in sensitive locations is important. Another solution is to use single layer capacitors in sensitive locations.
Pyroelectric Effects
Surface Acoustic Wave (SAW) filters commonly used in radios are made from a piezoelectric ceramic dielectric material. The SAW dielectric materials also exhibit a property known as the pyroelectric effect. Recall that physical stress on a crystal lattice or ferroelectric material alters the charge arrangement and can create large static piezoelectric voltages. Similarly, in a pyroelectric material temperature changes can stress the dielectric lattice and create large static voltages.
The pyroelectric effect in SAW devices can be very strong, developing large voltages on the substrate as temperature is varied. The voltage can become so high as to create arcing in the device, which in turn causes phase-hits. The pyroelectric effect is most predominant at temperatures between -10 ºC and 0 ºC. Radios with SAW devices suffering from phasehits around these temperatures should be evaluated for pyroelectric discharges.
SAW manufacturers have responded with special devices that minimize the discharge problem. One approach uses a thin resistive coating on the dielectric to dissipate the charge buildup and prevent arcing. Another approach engineers the dielectric material so the charge buildup occurs at lower temperatures outside the normal operating range.
If the operating temperature range goes below 0 ºC pyroelectric phase-hits can be a problem. As with most all phase-hit problems, capturing the event to make a positive diagnosis can be difficult because the electrical discharge occurs briefly and unpredictably. In the next section, we look at how the RTSA's unique Frequency Mask Trigger (FMT) can find these events every time.
Capturing the Event
Phase-hits and microphonics are usually transient and unpredictable events. Phase-hits can be particularly random. Even with microphonics, capturing the exact instant of a microphonic frequency burst can be challenging. In the field it can be difficult to determine exactly what caused a carrier loss event. Diagnostics are often needed to figure out if it was a phase-hit or microphonic event.
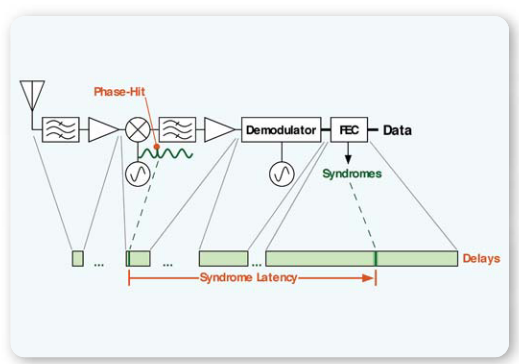
Traditional approaches such as triggering a swept spectrum analyzer off an external syndrome (symbol error) source can be difficult to time align. Forward Error Correction (FEC) and syndrome latency can require analysis of many events to figure out the appropriate pre-trigger delay to capture the proper instant in time. In some designs, the syndrome latency is dependent on the lock state of the demodulator making triggering at the exact event time a matter of luck.
Even if it is possible to determine the appropriate pre-trigger delay, one still needs to analyze the magnitude of the phase error to predict how the phase lock loop or carrier recovery will respond. Most spectrum analyzers have no direct phase analysis capability. Using a Vector Signal Analyzer (VSA) can provide phase analysis, but triggering on the event can be very difficult. Access to syndrome error logic lines is required with a VSA, which may not be available on many designs.
The RTSA solves both the phase analysis and triggering problems with its unique real-time Frequency Mask Trigger and multi-domain analysis.
The RTSA solves both the phase analysis and triggering problems with its unique real-time Frequency Mask Trigger and multi-domain analysis.
Transients and the FMT
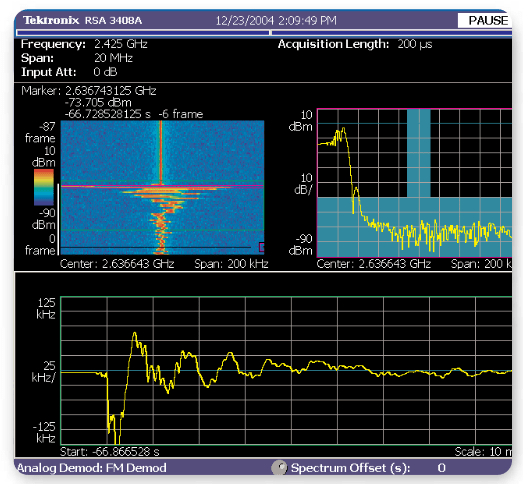
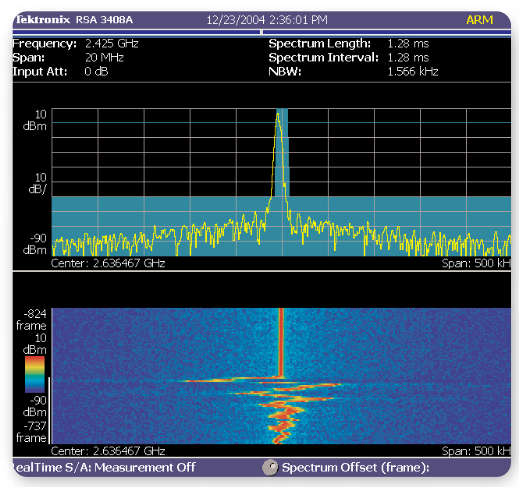
Tektronix's patented frequency mask trigger is ideal for the task of triggering on these elusive events, because it can analyze the signal for spectral anomalies in real-time. Virtually all other signal analyzers convert time sampled signals to the frequency domain with batch post processing. Batch post processing means it is not possible to continuously analyze the input signal in the frequency domain, just occasional pieces of it. The RTSA has special dedicated real-time DSP hardware that is so fast it can convert time domain samples to the frequency domain and evaluate them before the next time sample frame is complete. Continuous real-time monitoring of the input signal with no missing pieces is possible. This capability allows the analyzer to run for days and detect even a small sub-millisecond phase-hit event with 100% probability of detection. In fact, the analyzer can even detect sub-micro second events, but those events are typically so short they rarely cause complete carrier recover loss (outside normal recovery loop bandwidths). Furthermore, since the event is captured based on its spectral anomaly, there is no need to try to adjust pre-trigger delays to align syndromes to RF events.
The convenience and value of this capability is most helpful
when diagnosing phase-hits that occur every day or two. To be able to reliably capture and analyze phase-hits starting with the first observation has not been practical in the past without the FMT. When a development project encounters synchronization losses from phase-hits or microphonics, the timesaving benefit of an RTSA can be great. Avoiding the wait for several events to adjust older VSA measurement equipment to capture the proper instant in time can save days or weeks of diagnostic delay.
Choosing the Measurement Point
When a radio link is having difficulties with synchronization loss, it becomes necessary to isolate the component that is causing the problem. In most radio systems, there are many oscillators used for generating the modulation, up/down conversion and carrier recovery. Determining which component that is creating an anomaly that causes carrier synchronization loss is generally done through a process of trial and error.
Monitor each LO with the RTSA using a tight spectral mask trigger to search for phase anomalies. If synchronization losses occur without a phase anomaly being triggered on the RTSA, a different LO frequency source must be responsible.
Generally, it is best to begin the diagnostic process with the highest frequency LOs, because the shorter the wavelength, the more susceptible it will be to the mechanisms likely to cause problems.
The next element one may wish to test is the demodulator sources. In many demodulators, crystal oscillators are used to clock precision DSP circuitry. Though typically lower in frequency, these sources can be very sensitive to phasehits or microphonics and should be examined next.
Depending on the urgency of the design release or the opportunity costs of a production stoppage, one might consider using multiple RTSAs to rapidly isolate the deficient component. Monitoring each frequency source for problems is the fastest way to determine where the synchronization loss is coming from. Unfortunately, since phase-hit and microphonic problems are most often found just before product release or in early production, the pressure for a rapid diagnosis and fix is usually high. Monitoring all the system sources at once to solve the problem rapidly is often the lowest project cost alternative available.
Another approach to shortening the diagnostic time in the laboratory is to send an un-modulated carrier through the transmitter and receiver, observing the output with the RTSA. Even though the phase anomaly could come from one of many system components, the captured waveform may provide some guidance to where exactly the problem originated. Mechanical ringing frequencies, temperature ranges or event durations can often implicate specific types of components for further study.
Characterizing the Phenomena
Once a problem is found, it is necessary to communicate to the component vendors how much improvement will be needed. To communicate the requirements clearly, the phenomena must be characterized in a manner that can be repeated by the component vendor with their RTSA and without the entire radio system.
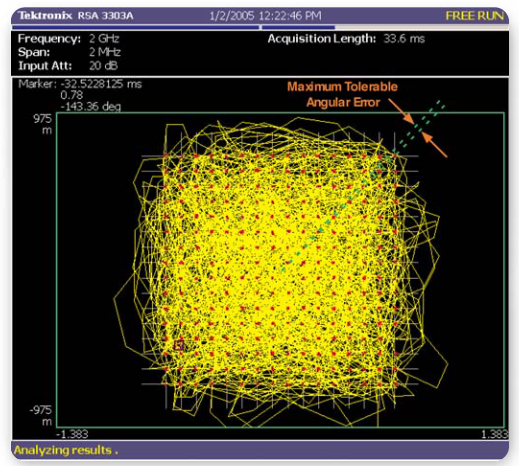
Understanding the phase deviation the modulated carrier undergoes is key to characterizing the disturbance and expressing the requirements for QAM modulations. Different levels of phase disturbances can create different problems in the demodulator. Very large phase transients greater than 90º and sustained for several symbol periods generally cause the carrier tracking to go non-linear and lose lock entirely. Depending on the carrier and symbol recovery implementation, momentary loss of lock could mean a short burst of errors or even several minutes of signal outage if a sweeping acquisition scheme is initiated from the momentary loss of lock.
As the modulation complexity increases, we find the sensitivity to phase errors also increases. Modulations such as 256 QAM are very sensitive and can only tolerate a maximum of 3.7º of carrier phase tracking error before syndromes are produced.
In comparison, Quadrature Phase Shift Keying (QPSK or 4 QAM) can tolerate 45º of phase error before syndromes are produced. To break carrier lock from nonlinearities, most QPSK demodulators need nearly the full 90º of phase error for several symbols.
Unfortunately, as the modulation complexity increases, more sophisticated carrier recovery schemes become essential. Continuous Wave (CW) modulations above 16 QAM usually employ decision directed carrier recovery. The Decision Feedback Phase Lock Loop (DFPLL) for carrier and symbol tracking provides a substantial improvement in demodulator performance at low signal to noise ratios. However, DFPLL's have a very narrow range of linear performance in their phase detectors. Very small phase transients can completely disrupt the carrier lock of a DFPLL. This is because the DFPLL's phase detector goes nonlinear with angle modulations that are less than the smallest maximum tolerable angular error for each symbol.
In general, phase transients from microphonics or phasehits should be kept smaller than the smallest maximum tolerable angular error in a QAM constellation being used.
Similarly, in Frequency Shift Keyed (FSK) modulations, frequency errors from microphonics should be kept below half the minimum tone spacing.
These guidelines for the maximum instantaneous angular error and frequency error allow us to specify the electrical response, but how do we define the mechanical stimulation?
Electro-Mechanical Modeling
To derive the maximum phase error that will be produced from an LO source due to a microphonic event, an electromechanical transfer function is needed, along with the maximum mechanical stimulus expected.
Mechanical stimuli come in two forms, shock impacts or continuous vibrations. Shock impacts are commonly produced from equipment doors slamming, connections to the equipment during operation, guns firing and drops during operation. Continuous vibrations can come from fans, engines and rocket propulsion. Shock impacts are time domain impulses, a force for a given period of time, and are best characterized with the Laplace transform. Continuous vibrations are frequency domain accelerations. These stimuli can be input into the electromechanical transfer function to compute the unwanted microphonic output phase or frequency modulation.
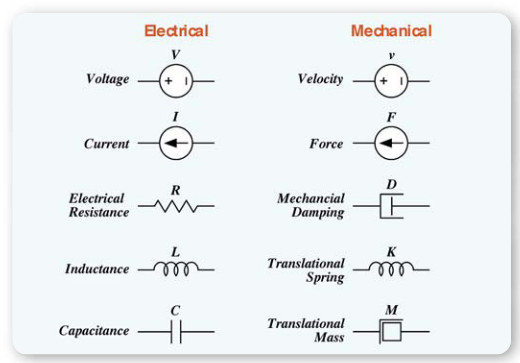
The electromechanical transfer function can be derived using lumped element component models and the System International (SI) units for the microphonic component.
In practice, constructing the transfer function from the electromechanical components can be difficult. Modeling programs rarely encompass both the electrical and mechanical elements together. Another problem that is often encountered with commercial analysis packages is the inability to allow parameters like ferroelectric capacitance to change with applied force. Further complicating matters, oscillators are often the most microphonic components in the system. Oscillator modeling in itself can be difficult because these devices operate in a nonlinear manner.
Empirical measurement is often the best way to characterize the electromechanical transfer function. The time required to develop detailed models of the transfer function is usually prohibitive at the system level. Recalling that microphonic problems are typically discovered late in the system integration phase of a project, the focus is usually on very rapid characterization and repair.
Modeling the mechanical portion of the system can be useful in understanding the resonant frequency of the mechanical elements, particularly at the component level. In microphonic responses, the component's natural mechanical frequencies can be determined and are helpful in identifying the offending component at the system level. Thus, component vendors may find modeling useful in development and marketing of their products.
To empirically determine transfer functions of microphoninc components, it is necessary to mechanically stimulate the input of the device with a calibrated signal and observe the output with the RTSA.
Shake Tables
Shake tables are the preferred approach to measure the electromagnetic transfer function across a frequency spectrum. Shake tables work well for characterization of microphonic behavior to continuous vibration sources. They also work well for determining the mechanical filtering or damping necessary to eliminate the electrical phase modulation. Shake tables for most electronic applications are driven by strong electromagnets similar to a loud speaker, but much more powerful. They enable shaking of the RF component or radio system with a known force across a range of frequencies. Using calibrated accelerometers, the acceleration or Gravitational equivalent (G), can be determined. This provides a calibrated mechanical stimulus useful for determining the electromechanical transfer function.
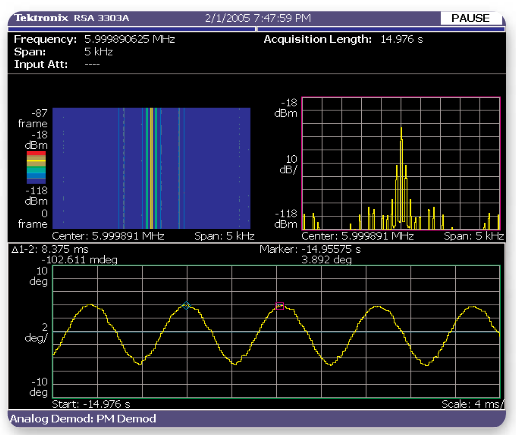
Using the RTSA, one can observe the phase modulation for a given acceleration stimulus and frequency. The RTSA comes equipped with an IEEE 488 buss, control capability that makes automating measurements of microphonic LO phase modulation to G force stimulus at each frequency a simple matter. This enables the plotting of the electromechanical transfer function.
Once the electromechanical transfer function is determined,it is possible to calculate the level of unwanted phase modulation that will result from a given stimulus. Simply multiply the stimulus level times the transfer function to determine the amount of unintentional phase modulation
Stimulus levels can be measured by placing an accelerometer on the platform that will carry the RF component or equipment.
Measuring stimulus levels and the electromechanical transfer function provides insight into the mechanisms that contribute to the unwanted microphonic modulation. Often one finds that vibrations are transmitted through equipment in unexpected ways, with resonances occurring in structural elements. The frequencies of these resonances can be raised by stiffening the structure or lowered by adding mass. Vibration dampening elastomers can be added to help absorb the energy.

Once the stimulus and transfer function are known, components and systems can be engineered to minimize the amount of unwanted microphonic modulation from continuous sources of vibration. It is also possible to specify the maximum phase error and the maximum G force at each frequency to component vendors.
Impulse Hammers
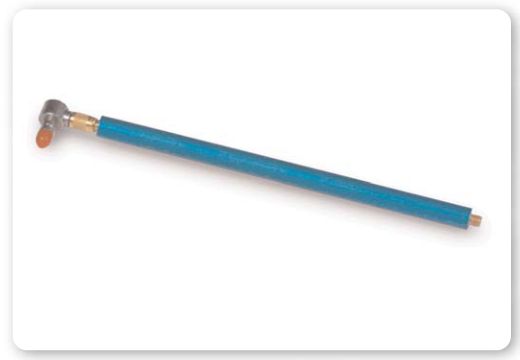
Impulse hammers are the preferred approach to characterizing time domain responses like mechanical shocks. An impulse hammer is a special hammer that provides an electronic output proportional to the force of the hammer's impact. A calibrated piezoelectric crystal in the head of the hammer produces a voltage proportional to the impact force.
Impulse hammers come in all sizes, from very small with head weights of a few grams, to large sledgehammers weighing many kilograms. Most electronic component characterization is done with a very small impulse hammer. The peak force they can generate from a strike is used to rate the hammer. Components rarely require more than a 50 lb. (222 N) strike force and electronic systems generally require less than a 250 lb. (1112 N) strike force. The rated strike force is the peak force exerted in the impact. 50 lb. may seem like a lot, but it is actually a small impulse because it occurs for such a short time period. A mechanical impulse is the product of the force times the duration of the impact. An impulse of 50 lb. (222 N) for 1 ms is similar to dropping a marble a short distance onto a hard surface.
When choosing an impulse hammer for testing a microphonic component that is sensitive to mechanical shocks, it is important to choose one that will respond over the appropriate frequency range. Small electronic components can be very light in mass and made with stiff materials. This can make their mechanical resonate frequencies as high as 20 kHz. To stimulate these high frequencies, a hammer with a low head mass is needed. It is also important to use a head material that is hard so the collision with the component is inelastic and very short in duration. The short duration collision creates a narrow impulse that contains a wide spectral stimulus. Small impact hammers for component testing have lightweight heads and thin tubing handles with very little mass.
The impulse hammer is connected to an oscilloscope or the RTSA. A preamp and piezoelectric bias may be required for some impulse hammers. When the hammer taps the test object, the time domain voltage on an oscilloscope or the frequency domain spectrum can be viewed on the RTSA. The impulse produced is dependent on the type of impact collision with the device under test. The more inelastic the collision the greater the spectral content. It may take a few taps to produce an impulse that stimulates the vibration modes of the device. Fortunately, it is possible to see on the oscilloscope just how hard and how short in duration the impulse was. Adjusting the strike force and impact angle can create a wide range of impulses.
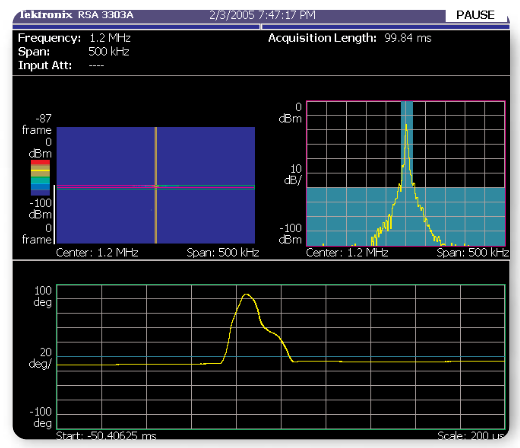
Using the multi-domain analysis capability of the RTSA,phase error versus time for the test device can be measured and compared to the impulse that stimulated the microphonic burst on the oscilloscope.
The impulse hammer thus provides a calibrated stimulus that can be used to communicate to the component manufacturer the impact force and duration that must be tolerated. The RTSA is used to measure the electrical portion of the microphonic response of the component.
On occasion, it is necessary to determine the maximum shock stimulus a radio will see in normal operation. This can be done with the help of some accelerometers attached to the product. An accelerometer senses the vibration or shock the product is exposed to. Accelerations seen at the component mounting can be converted to force impulses. An impact hammer is then used to simulate these forces at the component vendor. This allows the vendor to simulate the environmental conditions their product will see for only the price of a relatively inexpensive impact hammer.
Temperature Cycling
As we have seen, shake tables or impulse hammers can be used to stimulate microphonic events for capture and analysis with the RTSA. Most microphonic responses are linear and easily characterized with linear stimulus and response techniques. Stimulating phase-hits is somewhat different from stimulating microphonic pickup.
Phase-hits occur more randomly and are generally caused by energy storage and sudden release of that energy with subsequent temperature changes. Phase-hits are not easily characterized with linear transfer functions. Rather, phase-hits are more correctly viewed as random phase error generators.
Measuring the peak response of a phase-hit with the RTSA is all that is needed. The FMT can trigger on a phase-hit and display its magnitude. The problem is stimulating the phase-hit. Temperature cycling from hot to cold is the most widely used method of stimulating phase-hits.
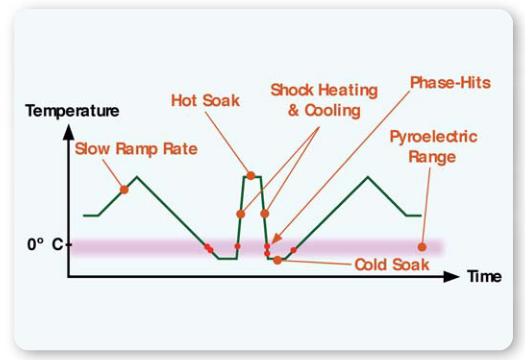
Some phase-hit generators can have hysteresis involved with storing up the energy that is released to cause a phase-hit. This can be affected by the temperature excursions and in some cases the ramp rates of the temperature. Using wide temperature ranges and varying the ramp rates can help stimulate phase-hit generators. Systems or components that use SAW devices outdoors should always be temperature cycled below -10º C to ensure the pyroelectric effect is not excessive.
Fortunately, the RTSA easily captures every phase-hit event that occurs, so a minimum number of events are needed to make a reliable diagnosis and fix.
Summary and Conclusions
Microphonics and phase-hits can pose significant problems to a new product release as well as production.
A variety of physical phenomena give rise to both microphonic sensitivity and phase-hits. Dimensional stability, piezoelectric materials, ferroelectric materials, YIG resonators, and magnetostriction can all make RF components microphonic. Similarly, differing coefficients of thermal expansion, microcracks, and the pyroelectric effect can create phase-hits.
The most difficult part of solving a microphonic or phase-hit problem is capturing these elusive events for analysis. The RTSA has made a significant contribution to the industry in reliably capturing phase-hits and analyzing microphonics events. Tektronix's patented frequency mask trigger makes capturing these random events easily and reliable. The multi-domain analysis capability of the RTSA provides a wealth of analysis information like phase error, frequency error and spectrograms. This allows the RTSA to substantially reduce the time taken to diagnose and characterize microphonic and phase-hit problems.
Find more valuable resources at TEK.COM
Copyright © Tektronix. All rights reserved. Tektronix products are covered by U.S. and foreign patents, issued and pending. Information in this publication supersedes that in all previously published material. Specification and price change privileges reserved. TEKTRONIX and TEK are registered trademarks of Tektronix, Inc. All other trade names referenced are the service marks, trademarks or registered trademarks of their respective companies.
05/05 37W-18577-1