Abstract
Using an Automated Parametric Test (APT) System, such as the Keithley S680 tester, to measure ring oscillator test structures provides test engineers with an inline tool to monitor semiconductor manufacturing quality and diagnose production problems in real time. Ring oscillator test structures have been in use for decades and continue to play a critical role in process monitoring of advanced technologies. At the 90nm technology node, a single-stage ring oscillator's frequency can be as high as 100GHz. Fortunately, a multi-stage ring oscillator coupled with a frequency divider can be designed to down-convert the output frequency to less than 100MHz, making frequency measurements less expensive and more feasible. This white paper demonstrates a practical,low cost, and high throughput method for measuring ring oscillator frequency.
Introduction
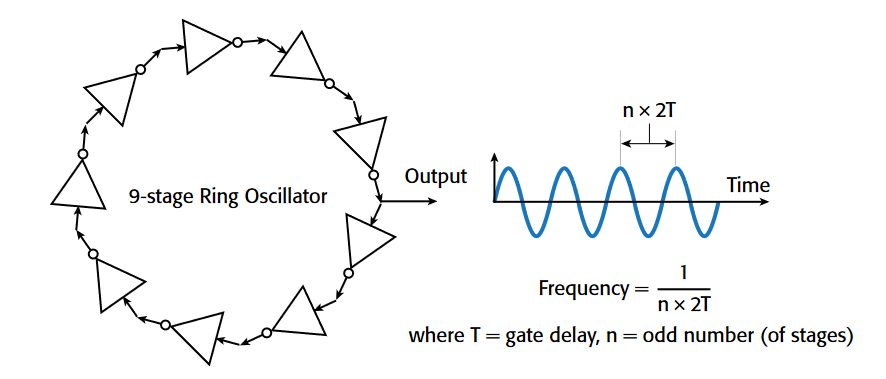
Short gate-delay times allow transistors to process data faster and improve overall circuit performance. A number of parameters have an impact on gatedelay time, including gate capacitance, channel mobility, etc. Therefore, design,process integration, and production process engineers evaluate and monitor gate-delay measurements in order to optimize and control the gate-delay time throughout the technology life cycle. At the 90nm technology node, gate-delay times can be as short as a few picoseconds, which corresponds to an oscillation frequency of 100GHz or higher. Measuring gate delays in the picosecond range directly is very complex and expensive, as well as infeasible in an inline production regime. On the other hand, the ring oscillator circuit can provide an indirect, yet accurate,measurement of the gate delay when measured with conventional lower-cost instruments.A ring oscillator is a device consisting of an odd number of NOT gates (inverters) in which the output voltage oscillates between binary levels. Each inverter delays the input signal for a certain period of time (the gate-delay time); at the output of the final stage, the total delay time is equal to the product of single gate-delay time multiplied by the number of stages.By measuring a ring oscillator's fundamental frequency, the average gate-delay time can be calculated, as shown in Figure 1.
In addition to a ring of inverters (inverter ring), the test structure often includes a frequency divider for down-converting the oscillator’s fundamental frequency [1] [2] [3] [4].A multi-stage frequency divider is typically used to lower the output frequency of the inverter ring from the gigahertz range to the megahertz range, which makes the circuit's fundamental output frequency (<100MHz) compatible with the types of probes, cables, and instruments typically used in production parametric testers.
This white paper demonstrates a practical, low cost, high throughput method for measuring a ring oscillator's frequency in a manufacturing environment. It includes an example of a typical ring oscillator test program and measurement results, along with tips on how to avoid picking up higher harmonic frequencies. Finally, a simple parallel technique for high throughput measurements is presented.
The ring oscillator test structures used in the development of this technique were fabricated with a typical 90nm technology on 300mm wafers. A Keithley S680 automated parametric tester was used to implement fully automated ring oscillator testing. The tester was equipped with either an Advantest Model R3131 (3GHz) spectrum analyzer or an Advantest Model U3751 (8GHz) spectrum analyzer to measure frequency and amplitude. The ring oscillator's fundamental frequency was confirmed with a Tektronix TDS3032 (300MHz) oscilloscope.
General Considerations
As part of the chip design process, IC designers, as well as technology development engineers and process integration engineers, need to consider ring oscillator design as part of their overall test strategy. The following considerations should be included in this strategy:
- Test structure (ring oscillator) output frequency
- Frequency bandwidth range of the probe card
- Frequency bandwidth range of the cables
- Frequency bandwidth of the switch matrix (internal to the test system)
- Frequency range of spectrum analyzer
The higher the test frequency requirements are, the higher the cost of test will be. Three frequency-bandwidth options are available in Keithley S680 Automated Parametric Testers: 60MHz, 1GHz, and 40GHz.
To control the cost of test, the ring oscillator test structure design can be adjusted to reduce the output frequency. A ring oscillator's total gate delay time is linearly proportional to the number of stages, according to the equation in Figure 1. The more stages there are, the lower the frequency will be. The influence of local process variations may result in slightly different gate-delay times for each inverter or stage in the ring oscillator. The effects of local process variation can be minimized by calculating the average gate-delay time; therefore, the more stages there are, the more accurate the test will be. However, the number of stages is limited by the available size of test-area (the allocated area on the chip for frequency test). In addition to increasing the number of inverter stages, a frequency divider further reduces the test structure’s output signal frequency. The reduction in frequency is exponentially proportional to the number of dividers in the chain (by 1/2m, with m equal to the number of stages in the divider). However, a digital frequency divider is made by a pair of flip-flops, and its area is approximately 10 times that of a ring oscillator's. Therefore, a compromise should be made by balancing the number of stages of the ring oscillator and the number of stages of the frequency divider in order to minimize test-area. In the end, the ring oscillator test structure's output frequency is given by:
| 1 | ||
| n× | 2T× | 2m |
where ftest is test frequency, T is the average gate-delay time, n and m are the number of stages in the ring oscillator and the number of frequency dividers respectively. For example, if n = 100, m = 5, T = 4 picoseconds, then ftest = 39.1MHz.
Automated Parametric Test System Description
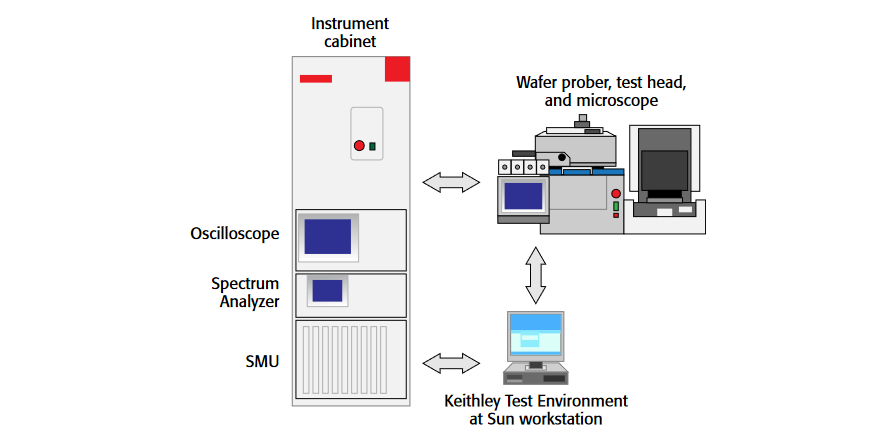
A 300mm wafer prober (in this case, a TSK [Tokyo Seimitsu Kogu Co., Ltd.] Accretech UF3000) was paired with the Keithley S680 Automated Parametric Test System configuration as illustrated in Figure 2. The DC bias needed to power the ring oscillator test structure was sourced from the system's Source-Measure Units (SMUs). The ring oscillator test structure's output signal was picked up by probe card and fed to the spectrum analyzer or other instruments via the test head and cables. The system was operated under the control of the Keithley Test Environment (KTE) software.
Test Program
The following code snippet example was developed for testing a ring oscillator structure using Keithley Test Environment software.
/* Include Header Files */
#include <stdio.h>
#include <lptdef.h>
#include <lptdef_lowercase.h>
#include <math.h>
#include <ksox _ def.h>
#include <AVTST3131_proto.h> /* Advantest R3131 prototype driver */
#include "freqstruct.h"
/* Connect instruments to probe pins via matrix */
conpin(SMU1,P1,0);
conpin(SMU2,P2,0);
conpin(SMU3,P2,0);
conpin(FOHM1,P4,0);
conpin(SMU1L,SMU2L,SMU3L,Pgrnd1,Pgrnd2,GND,0);
/* Configure SMUs for Ring Oscillator Test */
setmode(SMU1, KI_LIM_MODE, KI_VALUE);
setmode(SMU2, KI_LIM_MODE, KI_VALUE);
setmode(SMU3, KI_LIM_MODE, KI_VALUE);
setmode(SMU1, KI_INTGPLC, 1.0);
setmode(SMU2, KI_INTGPLC, 1.0);
lorangei(SMU1,100.0e-9);
lorangei(SMU2,100.0e-9);
limiti(SMU1,I1);
limiti(SMU2,I2);
limiti(SMU3,I3);
setauto(SMU1);
setauto(SMU2);
/* Sequence power up of ring oscillator to ensure single mode oscillation */
forcev(SMU3,V3);
forcev(SMU1,V1);
forcev(SMU2,V2);
/* Delay to ensure stable oscillation */
rdelay(Delay);
/* Power up ring oscillator and measure current */
measi(SMU1,Im1);
measi(SMU2,Im2);
/* Setup spectrum analyser for measurement */
Spastat = freq_init();
Spastat = freq_setup(low,high,rbw);
/* Make frequency and magnitude measurement using spectrum analyzer */
Spastat = freq_measure(&&Freq,Vpeak);
/* Reset SMUs and clear matrix relays */
devint();
return;
Test Results
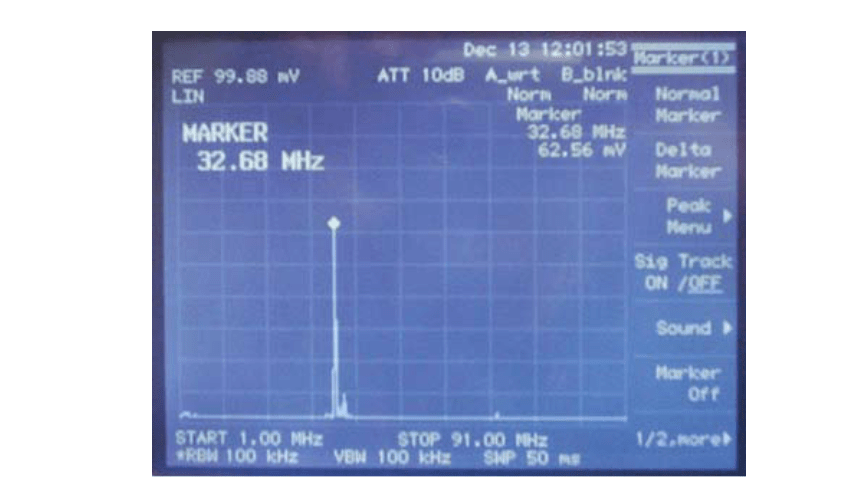
Figure 3 shows the results of measuring a ring oscillator's frequency and peak amplitude with a spectrum analyzer. The X-axis is set to 9MHz per division. The frequency sweep (along the x-axis) starts at 1MHz and stops at 91MHz with a bandwidth resolution of 0.1MHz. The amplitude is on a linear scale of 10mV per division. The spectral peak of the ring oscillator output occurs at 32.68MHz with an amplitude of 62.56mV. Note the very quiet noise floor.This is an indication of both good ring oscillator test structure design and a good test system architecture.
The fundamental frequency of a ring oscillator increases as the voltage increases, which causes the ring oscillator to act as a voltage-controlled oscillator (VCO). The VCO effect is not difficult to explain. When the voltage applied to the drain of the transistors VDD is increased, both input signal rise time and output signal fall-time are reduced; therefore, gatedelay time is reduced and oscillation frequency increases. The actual test results reflect this relationship clearly:
| VDD | 0.8V | 1.0V | 1.2V |
| Frequency | 17.2MHz | 26.3MHz | 33.4MHz |
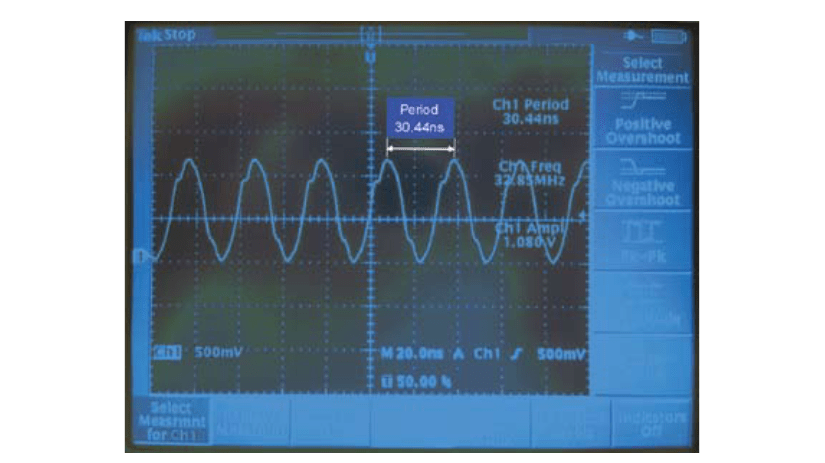
The measurements in this table were made using a spectrum analyzer. To validate these results, the same ring oscillator was measured with an oscilloscope. Figure 4 shows the waveform of the ring oscillator as viewed with an oscilloscope. The period of the waveform is 30.44 nanoseconds and the corresponding frequency is 32.85MHz. These results are consistent with the spectrum analyzer measurement and confirm that the measurement was made on fundamental frequency rather than a harmonic.
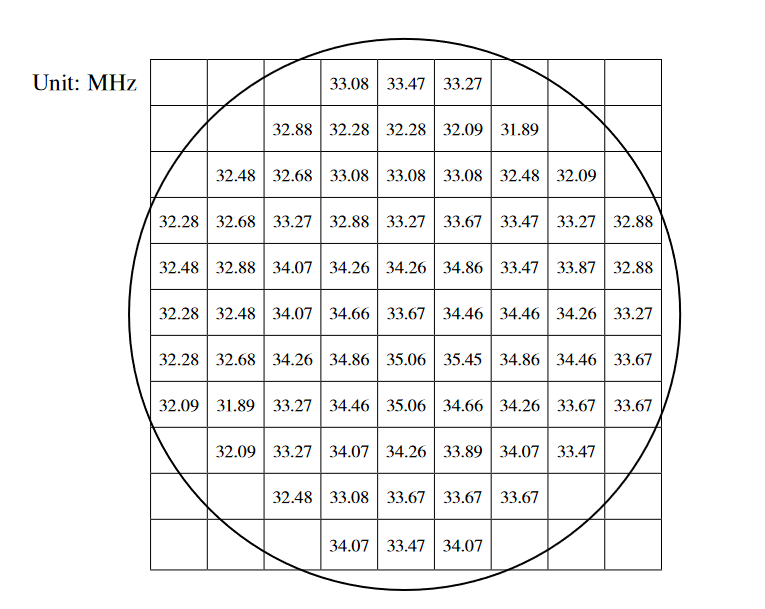
Ring oscillator measurements often must be made across the length and width of the entire wafer to understand the process's impact on the gate-delay time. To demonstrate the production capability of the ring oscillator measurement, the S680 tester was instructed to perform the measurement on all wafer sites. Figure 5 shows a wafer map of the ring oscillator frequency measurements spanning a full 300mm wafer. The average oscillation frequency throughout the wafer was 33.45MHz with a standard deviation of 0.88MHz. This result demonstrates the uniformity of the production wafer.
Harmonic Analysis
Due to the bistable multivibrator behavior of the ring oscillator, harmonic frequencies are always present to some degree. The following example examines a ring oscillator that has a lower fundamental frequency than that in the first example. This ring oscillator was chosen because it is rich in harmonics less than 100MHz. Figure 6 shows the frequency spectrum of the ring oscillator's output. The frequency axis is set to 9.9MHz per division and the frequency sweep starts at 1MHz and stops at 100MHz, with a bandwidth resolution of 0.1MHz. The amplitude is on the logarithmic scale and set to 10dB per division. The fundamental peak occurs at 10.90MHz at an amplitude of 259mV, or -5.72dB. It is important to note that the amplitude (Y-axis) is displayed in logarithmic scale, which makes it easier to observe harmonic peaks than if they were shown in linear scale.
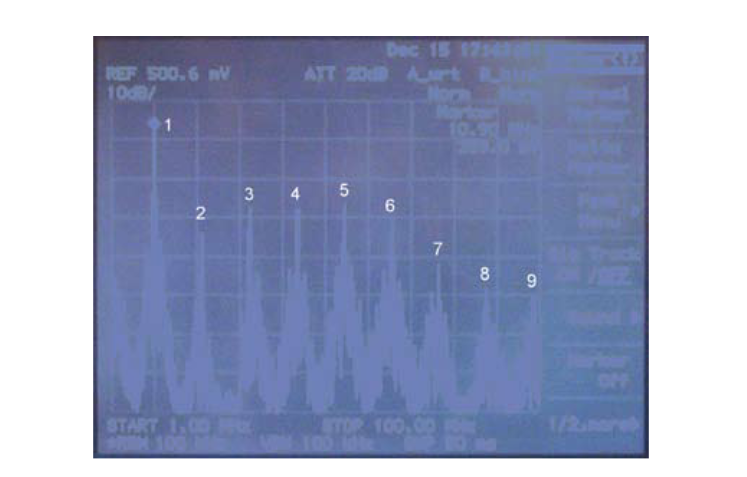
The -3dB bandwidth of high frequency matrix of S680 tester is 60MHz. If the oscillation frequency is higher than 60MHz, the signal still can be seen via the spectrum analyzer,but the attenuation caused by the matrix is greater. The table below shows the amplitude of the fundamental and harmonics of the ring oscillator test structure. Note the relatively high magnitude of the first harmonic.
Occasionally, a spectrum analyzer can pick up higher-order harmonic signals, which can cause a false fundamental frequency reading. The best way to avoid detecting and measuring higher harmonics is to set the sweep-stop frequency less than the second harmonic frequency.For example, if the estimated second harmonic frequency is 50MHz, then set the sweepstop frequency to 40MHz. If it is difficult to estimate the second harmonic frequency, an alternative technique is to set a low limit for peak amplitude. For example, if the estimated fundamental amplitude is 100mV, then set the lower amplitude limit to 30mV. This technique works because the amplitude of the fundamental frequency is always the highest among all the harmonics, as seen in the preceding table. A third method for avoiding higher harmonic frequencies is to force supply voltage and subsequently enable (trig) voltage [5]. It is important to add a delay time after supply-voltage is forced and before enable-voltage is forced. This ensures that the ring is initialized in a known state; otherwise, more than one oscillation cycle could be traveling around the ring. This approach should be considered during the chip design stage [5].
Throughput Improvement Through Parallel Testing
Many techniques are available to enhance throughput of an automated parametric tester,including parallel testing. To demonstrate parallel testing of ring oscillators, the Keithley Test Environment (KTE) software controlled two spectrum analyzers installed in the S680 tester to measure two ring oscillators simultaneously. Using this simple parallel test technique can reduce total test time by ~25-30%. The isolation of high frequency signals within the S680 tester's switch matrix is sufficient to test ring oscillators in parallel.
Summary
This paper demonstrates the capability to implement precision ring oscillator measurements in a production setting using a Keithley S680 tester. Careful selection of test structures and appropriate test system design tradeoffs can allow low cost, precise, and high throughput production testing. These tradeoffs start with the basis of frequency down-conversion within the test structure, which impacts tester configuration, test code, and the wafer sampling plan.High throughput low cost ring oscillator test can increase visibility into process performance,as demonstrated by the wafer map of ring oscillator frequency shown earlier in this document.
Find more valuable resources at TEK.COM
Copyright © Tektronix. All rights reserved. Tektronix products are covered by U.S. and foreign patents, issued and pending. Information in this publication supersedes that in all previously published material. Specification and price change privileges reserved. TEKTRONIX and TEK are registered trademarks of Tektronix, Inc. All other trade names referenced are the service marks, trademarks or registered trademarks of their respective companies.
No.2917 0408.1K.DCI