- 领先的实时技术有助于解决现场最棘手的瞬态干扰
- 集成解决方案设计降低了总拥有成本,降低了初始购买成本和年度维护成本
- 开放数据格式通过与行业标准产品的兼容性提高了资产的利用率
- 易于使用的平台提高了现场测试效率,降低了系统培训成本
联系我们
与泰克代表实时聊天。 工作时间:上午 9:00 - 下午 5:00(太平洋标准时间)。
致电我们
工作时间:上午9:00-下午5:00(太平洋标准时间)
下载
下载手册、产品技术资料、软件等:
反馈
| SPECMON3B | SPECMON6B | SPECMON26B | |
|---|---|---|---|
| Frequency range | 1 Hz to 3.0 GHz | 1 Hz to 6.2 GHz | 1 Hz to 26.5 GHz |
| Real-time acquisition BW | 25 MHz (SPECMON3B only), 40 MHz, 85 MHz, 125 MHz, 165 MHz | ||
| Minimum Event Duration for 100% POI at 100% amplitude | 2.7 μs at 165 MHz BW (0.434 μs Opt. 300) 2.8 μs at 85 MHz BW (0.551 μs Opt. 300) 3.0 μs at 40 MHz BW (0.79 μs Opt. 300) 3.2 μs at 25 MHz BW (0.915 μs Opt. 300) | ||
| SFDR (typical) | >75 dBc (25/40 MHz) >73 dBc (85/125/165 MHz) ≥80 dBc (Opt. B85HD, B125HD, B16xHD) | ||
| Trigger modes | Free run, Triggered, FastFrame | ||
| Trigger types | Power, Frequency mask, Frequency edge, DPX density, Runt, Time qualified | ||
±(RE × MF + 0.001 × Span + 2) Hz
(RE = Reference frequency error)
(MF = Marker frequency (Hz))
Every 1 MHz from 1 to 100 MHz plus 1.2288 MHz, 4.8 MHz, and 19.6608 MHz.
External input must be within ± 1 x 10 -6(Std), ± 3 x 10 -7(Opt PFR) to stated input
1Exact number depends on Bandwidth, Sample Rate, Acquisition time. Achieved up to 200,000 pulses
| Acquisition BW | Sample rate (for I and Q) | Record length | Record length (Opt. 53) | Time resolution |
|---|---|---|---|---|
| 165 MHz | 200 MS/s | 1.34 s | 5.37 s | 5 ns |
| 85 MHz | 200 MS/s | 1.34 s | 5.37 s | 5 ns |
| 80 MHz | 100 MS/s | 2.68 s | 10.74 s | 10 ns |
| 40 MHz | 50 MS/s | 4.77 s | 19.09 s | 20 ns |
| 25 MHz | 50 MS/s | 4.77 s | 19.09 s | 20 ns |
| 20 MHz | 25 MS/s | 9.54 s | 38.18 s | 40 ns |
| 10 MHz | 12.5 MS/s | 19.09 s | 76.35 s | 80 ns |
| 5 MHz | 6.25 MS/s | 38.18 s | 152.71 s | 160 ns |
| 2 MHz | 3.125 MS/s | 42.9 s | 171.8 s | 320 ns |
| 1 MHz | 1.563 MS/s | 85.9 s | 343.6 s | 640 ns |
| 500 kHz | 781.25 kS/s | 171.8 s | 687.2 s | 1.28 μs |
| 200 kHz | 390.625 kS/s | 343.6 s | 1374.4 s | 2.56 μs |
| 100 kHz | 195.313 kS/s | 687.2 s | 2748.8 s | 5.12 μs |
| 50 kHz | 97.656 kS/s | 1374.4 s | 5497.6 s | 10.24 μs |
| 20 kHz | 48.828 kS/s | 2748.8 s | 10995.1 s | 20.48 μs |
| 10 kHz | 24.414 kS/s | 5497.6 s | 21990.2 s | 40.96 μs |
| 5 kHz | 12.207 kS/s | 10995.1 s | 43980.5 s | 81.92 μs |
| 2 kHz | 3.052 kS/s | 43980.4 s | 175921.8 s | 328 μs |
| 1 kHz | 1.526 kS/s | 87960.8 s | 351843.6 s | 655 μs |
| 500 Hz | 762.9 S/s | 175921.7 s | 703687.3 s | 1.31 ms |
| 200 Hz | 381.5 S/s | 351843.4 s | 1407374.5 s | 2.62 ms |
| 100 Hz | 190.7 S/s | 703686.8 s | 2814749.1 s | 5.24 ms |
Spectrum (amplitude vs linear or log frequency)
DPX®spectrum display (live RF color-graded spectrum)
Spectrogram (amplitude vs frequency over time)
Spurious (amplitude vs linear or log frequency)
Phase noise (phase noise and Jitter measurement) (Opt. 11)
Amplitude vs time
Frequency vs time
Phase vs time
DPX amplitude vs time
DPX frequency vs time
DPX phase vs time
Amplitude modulation vs time
Frequency modulation vs time
RF IQ vs time
Time overview
CCDF
Peak-to-Average ratio
Noise figure vs. frequency
Gain vs. frequency
Noise figure, gain at a single frequency
Y-factor vs. frequency
Noise temperature vs. frequency
Uncertainty calculator
Results table of all measurements
Pulse results table
Pulse trace (selectable by pulse number)
Pulse statistics (trend of pulse results, FFT of time trend and histogram)
Cumulative Statistics, Cumulative Histogram and Pulse-Ogram
Constellation diagram
EVM vs time
Symbol table (binary or hexadecimal)
Magnitude and phase error versus time, and signal quality
Demodulated IQ vs time
Eye diagram
Trellis diagram
Frequency deviation vs time
Constellation, scalar measurement summary
EVM or power vs carrier
Symbol table (binary or hexadecimal)
WLAN Power vs time, WLAN symbol table, WLAN constellation, Spectrum emission mask
Error vector magnitude (EVM) vs symbol (or time), vs subcarrier (or frequency)
Mag error vs symbol (or time), vs subcarrier (or frequency)
Phase error vs symbol (or time), vs subcarrier (or frequency)
Channel frequency response vs symbol (or time), vs subcarrier (or frequency)
Spectral flatness vs symbol (or time), vs subcarrier (or frequency)
RF output power, operating frequency accuracy, modulation emission spectrum,
unwanted emissions spurious, adjacent channel power ratio, frequency deviation,
modulation fidelity, frequency error, eye diagram, symbol table, symbol rate accuracy,
transmitter power and encoder attack time, transmitter throughput delay, frequency deviation vs. time,
power vs. time, transient frequency behavior, HCPM transmitter logical channel peak adjacent channel power ratio,
HCPM transmitter logical channel off slot power, HCPM transmitter logical channel power envelope,
HCPM transmitter logical channel time alignment, cross-correlated markers
Peak power, average power, adjacent channel power or inband emission mask,
-20dB bandwidth, frequency error, modulation characteristics including ΔF1avg (11110000),
ΔF2avg (10101010), ΔF2 > 115 kHz, ΔF2/ΔF1 ratio, frequency deviation vs. time with packet
and octet level measurement information, carrier frequency f0, frequency offset (Preamble
and Payload), max frequency offset, frequency drift f1-f0, max drift rate fn-f0
and fn-fn-5, center frequency offset table and frequency drift table, color-coded
symbol table, packet header decoding information, eye diagram, constellation diagram,
editable limits.
≤10 MHz, approximately Gaussian, shape factor 4.1:1 (60:3 dB), ±10% typical
20 MHz (60 MHz, Opt. B16x), shape factor <2.5:1 (60:3 dB) typical
| Frequency span | RBW |
|---|---|
| >10 MHz | 100 Hz |
| >1.25 MHz to 10 MHz | 10 Hz |
| ≤1 MHz | 1 Hz |
| ≤100 kHz | 0.1 Hz |
1500 MHz/s (Std.)
2500 MHz/s (Opt. B40)
6000 MHz/s (Opt. B16x)
| Trace length (points) | Minimum FFT length |
|---|---|
| 801 | 1024 |
| 2401 | 4096 |
| 4001 | 8192 |
| 10401 | 16384 |
| Characteristic | Performance |
|---|---|
| Spectrum processing rate (RBW = auto, trace length 801) | 390,625 per second |
| Spectrum processing rate (RBW = auto, trace length 801) (Option 300 with Option 09) | 3,125,000 per second for Span/RBW ratio ≤ 333 |
| 390,625 per second for Span/RBW ratio > 333 | |
| DPX bitmap resolution | 201 × 801 |
| DPX bitmap color dynamic range | 233 levels |
| Marker information | Amplitude, frequency, and signal density on the DPX display |
| Minimum signal duration for 100% probability of detection (Max-hold on) | See minimum signal duration for 100% probability of trigger at 100% amplitude table |
| Span Range (Continuous processing) | 100 Hz to 25 MHz (40 MHz with Opt. B40) (85 MHz with Opt. B85/B85HD) (125 MHz with Opt. B125/B125HD) (165 MHz with Opt. B16x/B16xHD) |
| Span range (Swept) | Up to instrument frequency range |
| Dwell time per step 1 | 50 ms to 100 s |
| Trace processing | Color-graded bitmap, +Peak, –Peak, average |
| Trace length | 801, 2401, 4001, 10401 |
| Resolution BW accuracy | ±0.5% |
1Minimum RBW, swept spans (Opt. 200) – 10 kHz
| Acquisition bandwidth | RBW (Min) | RBW (Max) |
|---|---|---|
| 165 MHz | 25 kHz | 20 MHz |
| 85 MHz | 12.9 kHz | 10 MHz |
| 40 MHz | 6.06 kHz | 10 MHz |
| 25 MHz | 3.79 kHz | 3.8 MHz |
| 20 MHz | 3.04 kHz | 3.04 MHz |
| 10 MHz | 1.52 kHz | 1.52 MHz |
| 5 MHz | 758 Hz | 760 kHz |
| 2 MHz | 303 Hz | 304 kHz |
| 1 MHz | 152 Hz | 152 kHz |
| 500 kHz | 75.8 Hz | 76 kHz |
| 200 kHz | 30.3 Hz | 30.4 kHz |
| 100 kHz | 15.2 Hz | 15.2 kHz |
| 50 kHz | 7.58 Hz | 7.6 kHz |
| 20 kHz | 3.03 Hz | 3.04 kHz |
| 10 kHz | 1.52 Hz | 1.52 kHz |
| 5 kHz | 758 Hz | 760 Hz |
| 2 kHz | 0.303 Hz | 304 Hz |
| 1 kHz | 0.152 Hz | 152 Hz |
| 500 Hz | 0.1 Hz | 76 Hz |
| 200 Hz | 0.1 Hz | 30.4 Hz |
| 100 Hz | 0.1 Hz | 15.2 Hz |
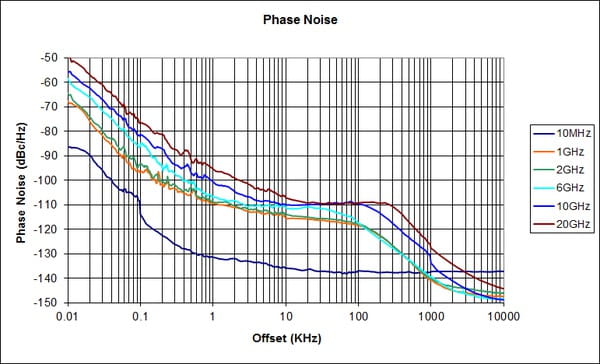
dBc/Hz at specified center frequency (CF)
| CF = 10 MHz | CF = 1 GHz | CF = 2 GHz | CF = 6 GHz | CF = 10 GHz | CF = 20 GHz | |
|---|---|---|---|---|---|---|
| Offset | Typical | Spec/Typical | Typical | Typical | Typical | Typical |
| 1 kHz | –128 | –103/–107 | –107 | –104 | –99 | –95 |
| 10 kHz | –134 | –109/–113 | –112 | –108 | –108 | –106 |
| 100 kHz | –134 | –112/–117 | –115 | –114 | –108 | –106 |
| 1 MHz | –135 | –130/–139 | –137 | –135 | –128 | –125 |
| 6 MHz | –140 | –137/–146 | –142 | –147 | –145 | –140 |
| 10 MHz | NA | –137/–146 | –142 | –147 | –147 | –144 |
Integrated from 1 kHz to 10 MHz.
| Measurement frequency | Integrated phase, radians |
|---|---|
| 1 GHz | 1.01 × 10⁻³ |
| 2 GHz | 1.23 × 10⁻³ |
| 6 GHz | 1.51 × 10⁻³ |
| 10 GHz | 2.51 × 10⁻³ |
| 20 GHz | 3.27 × 10⁻³ |
Typical phase noise performance as measured by Opt. 11.
Specifications excluding mismatch error
±0.3 dB (SPECMON3B/SPECMON6B)
±0.15 dB (SPECMON26B)
118 °C to 28 °C, Ref Level ≤ -15 dBm, Attenuator Auto-coupled, Signal Level -15 dBm to -50 dBm. 10 Hz ≤ RBW ≤ 1 MHz, after alignment performed.
| Typical | |||
|---|---|---|---|
| SPECMON3B / SPECMON6B 1 | |||
| Frequency range | Preamp OFF (95% confidence) | Preamp ON (Typical) | Preamp ON, 0 dB attenuation (Typical) |
| >10 kHz to 10 MHz | <1.6 | -- | -- |
| >10 MHz to 2.0 GHz | <1.1 | <1.2 | <1.5 |
| >2 GHz to 3 GHz | <1.25 | <1.4 | <1.6 |
| >3 GHz to 5 GHz | <1.25 | <1.4 | <1.4 |
| >5 GHz to 5.5 GHz | <1.3 | <1.4 | <1.4 |
| >5.5 GHz to 6.2GHz | <1.3 | <1.4 | <1.75 |
| Typical | |||
|---|---|---|---|
| SPECMON26B 1 | |||
| Frequency range | Preamp OFF (95% confidence) | Preamp ON (Typical) | Preamp ON, 0 dB attenuation (Typical) |
| >10 kHz to 10 MHz | <1.6 | -- | -- |
| 10 MHz to 3.0 GHz | <1.3 | <1.4 | <1.9 |
| >3.0 GHz to 6.2 GHz | <1.3 | <1.5 | <1.9 |
| >6.2 GHz to 11 GHz | <1.5 | <1.8 | <2.25 |
| >11 GHz to 15 GHz | <1.5 | <1.8 | <1.9 |
| >15 GHz to 22 GHz | <1.5 | <1.8 | <1.9 |
| >22 GHz to 25 GHz | <1.7 | <2.0 | <1.9 |
| >25 GHz to 26.5 GHz | <1.7 | <2.0 | <2.1 |
1Atten. = 10 dB, CF set within 200 MHz of VSWR frequency
1Each signal level –25 dBm, Ref level –20 dBm, Attenuator = 0 dB, 1 MHz tone separation.
| Frequency range | 3rd order intermodulation distortion, dBc (typical) | 3rd order intercept, dBm (typical) | ||
|---|---|---|---|---|
| SPECMON3B/6B | SPECMON26B | SPECMON3B/6B | SPECMON26B | |
| 10 kHz to 32 MHz (LF band) | –75 | –75 | +12.5 | +12.5 |
| 1 MHz to 120 MHz | –70 | –70 | +10 | +10 |
| >80 MHz to 300 MHz | –76 | –76 | +13 | +13 |
| >300 MHz to 6.2 GHz | –84 | –82 | +17 | +16 |
| >6.2 GHz to 15 GHz | -- | –72 | -- | +11 |
| 15 GHz to 26.5 GHz | -- | –72 | -- | +11 |
1Each signal level –25 dBm, Ref level –20 dBm, Attenuator = 0 dB, 1 MHz tone separation.
| Frequency range | 3rd order intermodulation distortion, dBc (typical) | 3rd order intercept, dBm (typical) | ||
|---|---|---|---|---|
| Specmon3/6/3B/6B | Specmon26/26B | Specmon3/6/3B/6B | Specmon26/26B | |
| 1 MHz to 32 MHz (LF band) | -75 | -75 | -12.5 | -12.5 |
| 1 MHz to 120 MHz | -70 | -80 | -15 | -10 |
| >120 MHz to 300 MHz | -75 | -80 | -12.5 | -10 |
| >300 MHz to 3.0 GHz | -80 | -90 | -10 | -5 |
| >3.0 GHz to 6.2 GHz | -90 | -90 | -5 | -5 |
| >6.2 GHz to 15 GHz | -- | -80 | -- | -10 |
| >15 GHz to 126.5 GHz | -- | -80 | -- | -10 |
1Each signal level –25 dBm, Ref level –20 dBm, Attenuator = 0 dB, 1 MHz tone separation.
| Frequency range | 2nd order harmonic distortion | |
|---|---|---|
| SPECMON3B/6B | SPECMON26B | |
| 10 MHz to 1 GHz | –80 | –80 |
| >1 GHz to 3.1 GHz | –83 | -- |
| >500 MHz to 1 GHz | -- | –74 |
| >1 GHz to 3.1 GHz | -- | –74 |
| >3.1 GHz to 7.5 GHz | -- | –85 |
| >7.5 GHz to 13.25 GHz | -- | –85 |
1–40 dBm at RF input, attenuator = 0, preamp off, typical
| SPECMON3B / SPECMON6B | ||
|---|---|---|
| Frequency range | Spec, dBm/Hz | Typical , dBm/Hz |
| LF Band | ||
| 1 Hz to 100 Hz | -- | –129 |
| >100 Hz to 2 kHz | –124 | –143 |
| >2 kHz to 10 kHz | –141 | –152 |
| >10 kHz to 32 MHz | –150 | –153 |
| RF band | ||
| 9 kHz to 1 MHz | –108 | –111 |
| >1 MHz to 10 MHz | –136 | –139 |
| >10 MHz to 2 GHz | –153 | –157 |
| >2 GHz to 3 GHz | –152 | –156 |
| >3 GHz to 4 GHz (SPECMON3B) | –151 | –155 |
| >4 GHz to 6.2 GHz (SPECMON6B) | –149 | –153 |
| SPECMON26B | ||
|---|---|---|
| Frequency range | Spec, dBm/Hz | Typical , dBm/Hz |
| LF Band | ||
| 1 Hz to 100 Hz | -- | –129 |
| >100 Hz to 2 kHz | –124 | –143 |
| >2 kHz to 10 kHz | –141 | –152 |
| >10 kHz to 32 MHz | –150 | –153 |
| RF band | ||
| 1 MHz to 10 MHz | –136 | –139 |
| >10 MHz to 3 GHz | –152 | –155 |
| >3 GHz to 4 GHz | –151 | –155 |
| >4 GHz to 6.2 GHz | –149 | –152 |
| >6.2 GHz to 13 GHz | –146 | –149 |
| >13 GHz to 23 GHz | –144 | –147 |
| >23 GHz to 26.5 GHz | –140 | –143 |
1Measured using 1 kHz RBW, 100 kHz span, 100 averages, minimum noise mode, input terminated, log-average detector and trace function.
| SPECMON6B | |
|---|---|
| Frequency range | 1 MHz to 3.0 GHz or 6.2 GHz |
| Noise figure at 2 GHz | <7 dB |
| Gain at 2 GHz | 20 dB (nominal) |
| SPECMON26B | |
|---|---|
| Frequency range | 1 MHz to 15 GHz or 26.5 GHz |
| Noise figure at 2 GHz | <10 dB |
| Noise figure at 26.5 GHz | <13 dB |
| Gain at 2 GHz | 20 dB (nominal) |
| SPECMON3B / SPECMON6B | ||
|---|---|---|
| Frequency range | Spec, dBm/Hz | Typical , dBm/Hz |
| LF Band | ||
| 1 MHz to 32 MHz | –158 | –160 |
| RF band | ||
| 1 MHz to 10 MHz | –158 | –160 |
| >10 MHz to 2 GHz | –164 | –167 |
| >2 GHz to 3 GHz | –163 | –165 |
| >3 GHz to 6.2 GHz (SPECMON6B) | –162 | –164 |
| SPECMON26B | ||
|---|---|---|
| Frequency range | Spec, dBm/Hz | Typical , dBm/Hz |
| RF band | ||
| 1 MHz to 10 MHz | –158 | –160 |
| >10 MHz to 2 GHz | –164 | –167 |
| >2 GHz to 3 GHz | –163 | –165 |
| >3 GHz to 4 GHz | –160 | –163 |
| >4 GHz to 6.2 GHz | –159 | –162 |
| >6.2 GHz to 13 GHz | –159 | –162 |
| >13 GHz to 23 GHz | –157 | –160 |
| >23 GHz to 26.5 GHz | –153 | –156 |
1Measured using 1 kHz RBW, 100 kHz span, 100 averages, minimum noise mode, input terminated, log-average detector and trace function.
| Span ≤25 MHz | Span ≤40 MHz (Opt. B40) 2 | Opt. B85/B125/B16x2 | Opt. B85HD, B125HD, B16xHD2 | ||||
|---|---|---|---|---|---|---|---|
| Swept spans >25 MHz | Swept spans >40 MHz | 40 MHz < span ≤ 160 MHz | 40 MHz < span ≤160 MHz | ||||
| Frequency | Specification | Typical | Specification | Typical | Specification | Typical | Typical |
| 10 kHz to 32 MHz (LF band) | –80 dBc | –85 dBc | -- | -- | -- | -- | -- |
| 30 MHz to 3 GHz | –73 dBc | –80 dBc | –73 dBc | –80 dBc | –73 dBc | –75 dBc | –80 dBc |
| >3 GHz to 6.2 GHz (SPECMON6B / SPECMON26B) | –73 dBc | –80 dBc | –73 dBc | –80 dBc | –73 dBc | –75 dBc | –80 dBc |
| 6.2 GHz to 15 GHz (SPECMON26B) | –70 dBc | –80 dBc | –70 dBc | –80 dBc | –70 dBc | –73 dBc | –80 dBc |
| 15 GHz to 26.5 GHz (SPECMON26B) | –66 dBc | –76 dBc | –66 dBc | –76 dBc | –66 dBc | –73 dBc | –76 dBc |
1RF input level = –15 dBm, Attenuator = 10 dB, Mode: Auto. Input signal at center frequency. Center Frequency > 90 MHz, Opt. B40/B85/B125/B16x/B85HD/B125HD/B16xHD. For acquisition bandwidth 15 - 25 MHz with signals at center frequency and at ±(37.5 MHz to 42.5 MHz): 65 dBc.
2CF> 150 MHz for Opt.B40/B85/B125/B16x/B85HD/B125HD/B16xHD
| Frequency | Typical |
|---|---|
| 10 kHz to 32 MHz (LF band) | –75 dBc |
| 30 MHz to 3 GHz | –75 dBc |
| 3 GHz to 6.2 GHz (SPECMON6B) | –75 dBc |
| 6.2 GHz to 15 GHz (SPECMON26B) | –75 dBc |
| 15 GHz to 26.5 GHz (SPECMON26B) | –68 dBc |
1RF Input Level = -15 dBm, Attenuator = 10 dB, Mode: Auto. Input signal at center frequency. Center frequency >90 MHz, Opt. B40/B85/B16x. For acquisition bandwidth 15 - 25 MHz with signals at center frequency and at ± (37.5 MHz to 42.5 MHz ): 65 dBc.
< –60 dBm (SPECMON3B / SPECMON6B)
< –90 dBm (SPECMON26B
| ACLR, typical | |||
|---|---|---|---|
| Signal type, measurement mode | Adjacent | Alternate | |
| 3GPP downlink, 1 DPCH | |||
| Uncorrected | –69 dB | –70 dB | |
| Noise corrected | –75 dB | –77 dB | |
| Measurement frequency (GHz) | Acquisition bandwidth | Amplitude flatness (Spec) | Amplitude flatness (typical, RMS) | Phase linearity (typical, RMS) |
|---|---|---|---|---|
| 0.001 to 0.032 (LF band) | ≤20 MHz | ±0.4 dB | 0.3 dB | 0.5° |
| 0.01 to 6.2 2 | ≤300 kHz | ±0.1 dB | 0.05 dB | 0.1° |
| 0.03 to 6.2 | ≤25 MHz | ±0.3 dB | 0.2 dB | 0.5° |
| Opt. B40 | ||||
| 0.03 to 6.2 | ≤40 MHz | ±0.3 dB | 0.2 dB | 0.5° |
| Opt. B85/B85HD | ||||
| 0.07 to 3.0 | ≤85 MHz | ±0.5 dB | 0.3 dB | 1.5° |
| >3.0 to 6.2 | ≤85 MHz | ±0.5 dB | 0.4 dB | 1.5° |
| Opt. B125/B125HD | ||||
| 0.07 to 6.2 | ≤125 MHz | ±0.5 dB | 0.4 dB | 1.5° |
| Opt. B16x/B16xHD | ||||
| >0.1 to 6.2 | ≤165 MHz | ±0.5 dB | 0.4 dB | 1.5° |
1Amplitude flatness and phase deviation over the acquisition BW, includes RF frequency response. Attenuator setting: 10 dB.
2High dynamic range mode selected.
1For masks >30 dB above noise floor.
100 Hz to 40 MHz (Opt. B40)
100 Hz to 85 MHz (Opt. B85HD)
100 Hz to 125 MHz (Opt. B125, B125HD)
100 Hz to 165 MHz (Opt. B16x, B16xHD)
±9 μs (RBW = auto)
±7 μs (RBW = Auto)
±5 μs (RBW = Auto)
| Frequency-Mask and DPX signal processing | Minimum signal duration, 100% probability of intercept, Frequency-Mask and DPX density trigger (μs) 1 | ||||||
|---|---|---|---|---|---|---|---|
| Span (MHz) | RBW (kHz) | FFT Length (points) | Spectrums / sec | Standard | Opt. 09 | ||
| Full amplitude | -3 dB | Full amplitude | -3 dB | ||||
| 165 MHz | 20000 | 1024 | 390,625 | 15.5 | 15.4 | 2.7 | 2.6 |
| 10000 | 1024 | 390,625 | 15.6 | 15.4 | 2.8 | 2.6 | |
| 1000 | 1024 | 390,625 | 17.8 | 15.7 | 5.0 | 2.9 | |
| 300 | 2048 | 195,313 | 23.4 | 16.3 | 13.1 | 6.1 | |
| 100 | 8192 | 48,828 | 44.5 | 23.4 | 44.5 | 23.4 | |
| 30 | 32768 | 12,207 | 161.9 | 91.7 | 161.9 | 91.7 | |
| 25 | 32768 | 12,207 | 178.0 | 93.6 | 178.0 | 93.6 | |
| 125 MHz | 10000 | 1024 | 390,625 | 15.6 | 15.4 | 2.8 | 2.6 |
| 1000 | 1024 | 390,625 | 17.8 | 15.7 | 5.0 | 2.9 | |
| 500 | 1024 | 390,625 | 20.2 | 15.9 | 7.4 | 3.1 | |
| 300 | 2048 | 195,313 | 23.4 | 16.3 | 13.1 | 6.1 | |
| 100 | 4096 | 97,656 | 44.5 | 23.4 | 34.2 | 13.2 | |
| 30 | 16384 | 24,414 | 120.9 | 50.7 | 120.9 | 50.7 | |
| 20 | 32768 | 24,414 | 201.9 | 96.5 | 201.9 | 96.5 | |
| 85 MHz | 10000 | 1024 | 390,625 | 15.6 | 15.4 | 2.8 | 2.6 |
| 1000 | 1024 | 390,625 | 17.8 | 15.7 | 5.0 | 2.9 | |
| 500 | 1024 | 390,625 | 20.2 | 15.9 | 7.4 | 3.1 | |
| 300 | 1024 | 390,625 | 23.4 | 16.3 | 10.6 | 3.5 | |
| 100 | 4096 | 97,656 | 44.5 | 23.4 | 34.2 | 13.2 | |
| 30 | 16384 | 24,414 | 121.0 | 50.7 | 121.0 | 50.7 | |
| 20 | 16384 | 24,414 | 161.0 | 55.6 | 161.0 | 55.6 | |
| 40 MHz | 5000 | 1024 | 390,625 | 15.8 | 15.4 | 3.0 | 2.6 |
| 1000 | 1024 | 390,625 | 17.8 | 15.7 | 5.0 | 2.9 | |
| 300 | 1024 | 390,625 | 23.3 | 16.3 | 10.5 | 3.5 | |
| 100 | 2048 | 195,313 | 39.4 | 18.3 | 29.1 | 8.1 | |
| 30 | 4096 | 97,656 | 90.4 | 21.8 | 90.4 | 21.8 | |
| 20 | 8192 | 48,828 | 140.7 | 36.3 | 140.7 | 36.3 | |
| 10 | 16384 | 24,414 | 281.3 | 72.6 | 281.3 | 72.6 | |
| 25 MHz | 3800 | 1024 | 390,625 | 16.0 | 15.4 | 3.2 | 2.6 |
| 1000 | 1024 | 390,625 | 17.7 | 15.7 | 4.9 | 2.9 | |
| 300 | 1024 | 390,625 | 23.4 | 16.3 | 10.6 | 3.5 | |
| 200 | 1024 | 390,625 | 27.4 | 16.8 | 14.6 | 4.1 | |
| Frequency-Mask and DPX signal processing (Option 300 with Option 09) | Minimum signal duration, 100% probability of intercept, Frequency-Mask and DPX density trigger (μs) 2 | |||||
|---|---|---|---|---|---|---|
| Span (MHz) | RBW (kHz) | FFT Length (points) | Spectrums / sec | Option 300 + Option 09 | ||
| Standard | Option 300 + Option 09 | Full amplitude | -3 dB | |||
| 165 MHz | 20000 | 1024 | 390,625 | 3,125,000 | 0.434 | 0.334 |
| 10000 | 1024 | 390,625 | 3,125,000 | 0.557 | 0.349 | |
| 1000 | 1024 | 390,625 | 3,125,000 | 2.7 | 0.662 | |
| 300 | 2048 | 195,313 | 195,313 | 13.1 | 6.1 | |
| 100 | 8192 | 48,828 | 48,828 | 44.5 | 23.4 | |
| 30 | 32768 | 12,207 | 12,207 | 161.9 | 91.7 | |
| 25 | 32768 | 12,207 | 12,207 | 178.0 | 93.6 | |
| 125 MHz | 10000 | 1024 | 390,625 | 3,125,000 | 0.551 | 0.348 |
| 1000 | 1024 | 390,625 | 3,125,000 | 2.7 | 0.662 | |
| 500 | 1024 | 390,625 | 3,125,000 | 5.1 | 1.2 | |
| 300 | 2048 | 195,313 | 195,313 | 13.1 | 6.1 | |
| 100 | 4096 | 97,656 | 97,656 | 44.5 | 13.2 | |
| 30 | 16384 | 24,414 | 24,414 | 120.9 | 50.7 | |
| 20 | 32768 | 24,414 | 24,414 | 201.9 | 96.5 | |
| 85 MHz | 10000 | 1024 | 390,625 | 3,125,000 | 0.55 | 0.348 |
| 1000 | 1024 | 390,625 | 3,125,000 | 2.7 | 0.662 | |
| 500 | 1024 | 390,625 | 3,125,000 | 5.1 | 1.2 | |
| 300 | 1024 | 390,625 | 3,125,000 | 8.3 | 1.9 | |
| 100 | 4096 | 97,656 | 97,656 | 34.2 | 13.2 | |
| 30 | 16384 | 24,414 | 24,414 | 121.0 | 50.7 | |
| 20 | 16384 | 24,414 | 24,414 | 161.0 | 55.6 | |
| 40 MHz | 5000 | 1024 | 390,625 | 3,125,000 | 0.79 | 0.377 |
| 1000 | 1024 | 390,625 | 3,125,000 | 2.7 | 0.663 | |
| 300 | 1024 | 390,625 | 3,125,000 | 8.3 | 1.9 | |
| 100 | 2048 | 195,313 | 195,313 | 29.1 | 8.1 | |
| 30 | 4096 | 97,656 | 97,656 | 90.4 | 21.8 | |
| 20 | 8192 | 48,828 | 48,828 | 140.7 | 36.3 | |
| 10 | 16384 | 24,414 | 24,414 | 281.3 | 72.6 | |
| 25 MHz | 3800 | 1024 | 390,625 | 3,125,000 | 0.915 | 0.392 |
| 1000 | 1024 | 390,625 | 3,125,000 | 2.7 | 0.664 | |
| 300 | 1024 | 390,625 | 3,125,000 | 8.3 | 1.9 | |
| 200 | 1024 | 390,625 | 3,125,000 | 12.3 | 2.8 | |
1Values displayed by the instrument may differ by 0.1μs
2Values displayed by the instrument may differ by 0.1μs
100 ns (minimum)
2000 s (maximum, Measurement BW >80 MHz)
Trace length = 801: 60,000 traces
Trace length = 2401: 20,000 traces
Trace length = 4001: 12,000 traces
Trace length = 10401: 4,600 traces
0.25 Hz to 25 MHz (Std.)
0.25 Hz to 40 MHz (Opt. B40)
0.25 Hz to 85 MHz (Opt. B85HD)
0.25 Hz to 125 MHz (Opt. B125, B125HD)
0.25 Hz to 165 MHz (Opt. B16x, B16xHD)
6.2 ns (ACQ BW = 165 MHz, no TDBW, Opt. B16x/B16xHD)
6.2 ns (ACQ BW = 85 MHz, no TDBW, Opt. B85/B85HD/B125/B125HD)
25 ns (ACQ BW = 40 MHz, no TDBW, Opt. B40)
25 ns (ACQ BW = 25 MHz, no TDBW, Std.)
±0.5 dB (level ≥ -50 dB from reference level)
±1.5 dB (from < -50 dB to -70 dB from reference level)
T1: 0 to 10 seconds
T2: 0 to 10 seconds
Shorter than T1
Longer than T1
Longer than T1 AND shorter than T2
Shorter than T1 OR longer than T2
I data: 16 bit LVDS
Q data: 16 bit LVDS
Carrier Power, Audio Frequency, Modulation Depth (+Peak, –Peak, Peak-Peak/2, RMS), SINAD, Modulation Distortion, S/N, Total Harmonic Distortion, Total Non-harmonic Distortion, Hum and Noise
Minimum offset from carrier: 10 Hz
Maximum offset from carrier: 1 GHz
Detection: average or ±Peak
Smoothing Averaging
Optimization: speed or dynamic range
| Frequency uncertainty at stated measurement bandwidth | |||||
|---|---|---|---|---|---|
| Measurement frequency, averages | 165 MHz | 85 MHz | 10 MHz | 1 MHz | 100 kHz |
| 1 GHz | |||||
| Single measurement | 2 kHz | 2 kHz | 100 Hz | 10 Hz | 1 Hz |
| 100 averages | 200 Hz | 200 Hz | 10 Hz | 1 Hz | 0.1 Hz |
| 1000 averages | 50 Hz | 50 Hz | 2 Hz | 1 Hz | 0.05 Hz |
| 10 GHz | |||||
| Single measurement | 5 kHz | 5 kHz | 100 Hz | 10 Hz | 5 Hz |
| 100 averages | 300 Hz | 300 Hz | 10 Hz | 1 Hz | 0.5 Hz |
| 1000 averages | 100 Hz | 100 Hz | 5 Hz | 0.5 Hz | 0.1 Hz |
| 20 GHz | |||||
| Single measurement | 2 kHz | 2 kHz | 100 Hz | 10 Hz | 5 Hz |
| 100 averages | 200 Hz | 200 Hz | 10 Hz | 1 Hz | 0.5 Hz |
| 1000 averages | 100 Hz | 100 Hz | 5 Hz | 0.5 Hz | 0.2 Hz |
| Frequency uncertainty at stated measurement bandwidth | ||||
|---|---|---|---|---|
| Measurement frequency, averages | 165 MHz | 85 MHz | 10 MHz | 1 MHz |
| 1 GHz | ||||
| Single measurement | 1.00° | 1.00° | 0.50° | 0.50° |
| 100 averages | 0.10° | 0.10° | 0.05° | 0.05° |
| 1000 averages | 0.05° | 0.05° | 0.01° | 0.01° |
| 10 GHz | ||||
| Single measurement | 1.50° | 1.50° | 1.00° | 0.50° |
| 100 averages | 0.20° | 0.20° | 0.10° | 0.05° |
| 1000 averages | 0.10° | 0.10° | 0.05° | 0.02° |
| 20 GHz | ||||
| Single measurement | 1.00° | 1.00° | 0.50° | 0.50° |
| 100 averages | 0.10° | 0.10° | 0.05° | 0.05° |
| 1000 averages | 0.05° | 0.05° | 0.02° | 0.02° |
| Specification | Description |
|---|---|
| Frequency range | 10 MHz to maximum frequency of instrument (nominal) |
| Noise figure measurement range | 0 to 30 dB (nominal) |
| Gain measurement range | -10 to 30 dB (nominal) |
| Noise figure and gain measurement resolution | 0.01 dB (nominal) |
| Noise figure measurement error | ±0.1 dB (typical) 1 |
| Gain measurement error | ±0.1 dB (typical) 1 |
Note: These conditions for Noise Figure and Gain specifications apply: Operating temperature 18 to 28 deg. C, after 20 minute warmup with internal preamp ON, immediately after internal alignment. Specified error includes only the error of the spectrum analyzer. Uncertainty from errors in ENR source level, external amplifier gain, low SN ratio and measurement system mismatch are not included, and can all be estimated using the uncertainty calculator included in the software.
1For (ENR of noise source) > (measured noise figure + 4 dB)
1Actual number depends on time length, pulse bandwidth and instrument configuration.
Measurement range: 15 to 40 dB across the width of the chirp
Measurement accuracy (typical): ±2 dB for a signal 40 dB in amplitude and delayed 1% to 40% of the pulse chirp width1
1Chirp width 100 MHz, pulse width 10 μs, minimum signal delay 1% of pulse width or 10/(chirp bandwidth), whichever is greater, and minimum 2000 sample points during pulse on-time.
1Pulse width >300 ns (100 ns, Opt. B85/B16x) SNR ≥30 dB
| Bandwidth | CF | RMS frequency error | Pulse to pulse frequency | Pulse to pulse delta frequency | Pulse to pulse phase |
|---|---|---|---|---|---|
| 25 MHz | 2 GHz | ±2.5 kHz | ±15 kHz | ±500 Hz | ±0.2° |
| 10 GHz | ±2.5 kHz | ±20 kHz | ±1.5 kHz | ±0.5° | |
| 20 GHz | ±3.5 kHz | ±25 kHz | ±2 kHz | ±0.8° | |
| 40 MHz | 2 GHz | ±3.5 kHz | ±20 kHz | ±1 kHz | ±0.2° |
| 10 GHz | ±5 kHz | ±30 kHz | ±2 kHz | ±0.5° | |
| 20 GHz | ±7.5 kHz | ±40 kHz | ±3 kHz | ±0.8° | |
| 60 MHz | 2 GHz | ±8 kHz | ±50 kHz | ±1.5 kHz | ±0.3° |
| 10 GHz | ±15 kHz | ±75 kHz | ±3 kHz | ±0.5° | |
| 20 GHz | ±20 kHz | ±100 kHz | ±4 kHz | ±0.8° | |
| 85 MHz | 2 GHz | ±15 kHz | ±100 kHz | ±2 kHz | ±0.3° |
| 10 GHz | ±20 kHz | ±125 kHz | ±3 kHz | ±0.5° | |
| 20 GHz | ±25 kHz | ±175 kHz | ±4 kHz | ±0.8° | |
| 160 MHz | 2 GHz | ±20 kHz | ±100 kHz | ±4.5 kHz | ±0.3° |
| 10 GHz | ±25 kHz | ±125 kHz | ±6 kHz | ±0.5° | |
| 20 GHz | ±40 kHz | ±175 kHz | ±8 kHz | ±0.8° |
1Pulse ON Power ≥ -20 dBm, Signal peak at reference Level, Attenuator = Auto, tmeas- treference≤ 10 ms, Frequency estimation: Manual. Pulse-to-Pulse measurement time position excludes the beginning and ending of the pulse extending for a time = (10 / Measurement BW) as measured from 50% of the t(rise)or t(fall). Absolute frequency error determined over center 50% of pulse.
| Bandwidth | CF | RMS frequency error | Pulse to pulse frequency | Pulse to pulse phase |
|---|---|---|---|---|
| 25 MHz | 2 GHz | ±5 kHz | ±15 kHz | ±0.25° |
| 10 GHz | ±8 kHz | ±20 kHz | ±0.5° | |
| 20 GHz | ±10 kHz | ±25 kHz | ±0.8° | |
| 40 MHz | 2 GHz | ±5 kHz | ±20 kHz | ±0.25° |
| 10 GHz | ±8 kHz | ±30 kHz | ±0.5° | |
| 20 GHz | ±10 kHz | ±50 kHz | ±0.8° | |
| 60 MHz | 2 GHz | ±25 kHz | ±125 kHz | ±0.3° |
| 10 GHz | ±30 kHz | ±150 kHz | ±0.5° | |
| 20 GHz | ±30 kHz | ±150 kHz | ±0.8° | |
| 85 MHz | 2 GHz | ±25 kHz | ±125 kHz | ±0.3° |
| 10 GHz | ±30 kHz | ±150 kHz | ±0.5° | |
| 20 GHz | ±30 kHz | ±175 kHz | ±0.8° | |
| 160 MHz | 2 GHz | ±35 kHz | ±125 kHz | ±0.3° |
| 10 GHz | ±40 kHz | ±150 kHz | ±0.5° | |
| 20 GHz | ±40 kHz | ±200 kHz | ±0.8° |
1Signal type: Linear chirp, Peak-to-Peak chirp deviation: ≤0.8 Measurement BW, Pulse ON Power ≥ -20 dBm, Signal peak at reference Level, Attenuator = 0 dB, tmeas- treference≤ 10 ms, Frequency estimation: Manual. Pulse-to-Pulse measurement time position excludes the beginning and ending of the pulse extending for a time = (10 / Measurement BW) as measured from 50% of the t(rise)or t(fall). Absolute frequency error determined over center 50% of pulse.
Constellation, Error vector magnitude (EVM) vs. Time, Modulation error ratio (MER), Magnitude error vs. Time, Phase error vs. Time, Signal quality, Symbol table, Rho
FSK only: Frequency deviation, Symbol timing error
1CF = 2 GHz, Measurement filter = Root raised cosine, Reference filter = Raised cosine, Analysis length = 200 symbols.
1CF = 2 GHz, Measurement filter = Root raised cosine, Reference filter = Raised cosine, Analysis length = 200 symbols.
1CF = 2 GHz, Measurement filter = Root raised cosine, Reference filter = Raised cosine, Analysis length = 400 symbols 20 averages.
1Reference Filter: MIL STD Measurement Filter: none.
1Reference Filter: MIL STD Measurement Filter: none.
1Reference Filter: MIL STD.
1Reference Filter: MIL STD.
1Reference filter: None, Measurement filter: None.
Carrier detect: 802.11, 802.16-2004 - Auto-detect; Manual select BPSK; QPSK, 16QAM, 64QAM
Channel estimation: Preamble, Preamble + Data
Pilot tracking: Phase, Amplitude, Timing
Frequency correction: On, Off
Symbol clock error, Frequency error, Average power, Peak-to-Average, CPE
EVM (RMS and peak) for all carriers, plot carriers, data carriers
OFDM parameters: Number of carriers, Guard interval (%), Subcarrier spacing (Hz), FFT Length
Power (Average, Peak-to-Average)
EVM vs symbol, vs subcarrier
Subcarrier power vs symbol, vs subcarrier
Mag error vs symbol, vs subcarrier
Phase error vs symbol, vs subcarrier
Channel frequency response
-49 dB (WiMAX 802.16-2004, 5 MHz BW)
-49 dB (WLAN 802.11g, 20 MHz BW)
Signal input power optimized for best EVM
Burst index, Burst power, Peak to average burst power, IQ origin offset, Frequency error, Common pilot error, Symbol clock error
RMS and Peak EVM for Pilots/Data, Peak EVM located per symbol and subcarrier
Packet header format information
Average power and RMS EVM per section of the header
WLAN power vs time, WLAN symbol table, WLAN constellation
Spectrum emission mask, spurious
Error vector magnitude (EVM) vs symbol (or time), vs subcarrier (or frequency)
Mag error vs symbol (or time), vs subcarrier (or frequency)
Phase error vs symbol (or time), vs subcarrier (or frequency)
WLAN channel frequency response vs symbol (or time), vs subcarrier (or frequency)
WLAN spectral flatness vs symbol (or time), vs subcarrier (or frequency)
Signal input power optimized for best EVM
Signal input power optimized for best EVM
Burst index, Burst power, Peak to average burst power, IQ origin offset, Frequency error, Common pilot error, Symbol clock error
RMS and Peak EVM for Pilots/Data, Peak EVM located per symbol and subcarrier
Packet header format information
Average power and RMS EVM per section of the header
WLAN power vs time, WLAN symbol table, WLAN constellation
Spectrum emission mask, spurious
Error vector magnitude (EVM) vs symbol (or time), vs subcarrier (or frequency)
Mag error vs symbol (or time), vs subcarrier (or frequency)
Phase error vs symbol (or time), vs subcarrier (or frequency)
WLAN channel frequency response vs symbol (or time), vs subcarrier (or frequency)
WLAN spectral flatness vs symbol (or time), vs subcarrier (or frequency)
Signal input power optimized for best EVM
unwanted emissions spurious, adjacent channel power ratio, frequency deviation,
modulation fidelity, frequency error, eye diagram, symbol table, symbol rate accuracy,
transmitter power and encoder attack time, transmitter throughput delay, frequency
deviation vs. time, power vs. time, transient frequency behavior, HCPM transmitter logical
channel peak adjacent channel power ratio, HCPM transmitter logical channel off slot power,
HCPM transmitter logical channel power envelope, HCPM transmitter logical channel time alignment
Phase 1 (C4FM): -74 dBc typical
Phase 2 (HCPM): -74 dBc typical
Phase 2 (HDQPSK): -75 dBc typical
1Measured with test signal amplitude adjusted for optimum performance if necessary. Measured with Averaging, 10 waveforms.
Peak power, average power, adjacent channel power or inband emission mask,
-20 dB bandwidth, frequency error, modulation characteristics including ΔF1avg (11110000),
ΔF2avg (10101010), ΔF2 > 115 kHz, ΔF2/ΔF1 ratio, frequency deviation vs. time with packet and octet
level measurement information, carrier frequency f0, frequency offset (Preamble and Payload), max
frequency offset, frequency drift f1-f0, max drift rate fn-f0and fn-fn-5, center frequency
offset table and frequency drift table, color-coded symbol table, packet header decoding information,
eye diagram, constellation diagram
Max freq. offset, drift f1- f0, max drift fn-f0, max drift fn-fn-5(50 μs)
73 dB
74 dB
Measurement data files (exported results)
Map file used for the measurements
Google earth KMZ file
Recallable results files (trace and setup files)
MapInfo-compatible MIF/MID files
±1% of span
(0 dBm input at center)
(Carrier frequency 1 GHz, 400 Hz/1 kHz Input/Modulated frequency)
±3°
(0 dBm input at center)
(Carrier frequency 1 GHz, 1 kHz/5 kHz Input/Modulated frequency)
1Frequency amplitude response may vary up to ±3 dB at +40 °C and greater than 45% relative humidity.
90 VACto 264 VAC, 50 Hz to 60 Hz
90 VACto 132 VAC, 400 Hz
UL 61010-1:2004
CSA C22.2 No.61010-1-04
EU council EMC Directive 2004/108/EC
EN61326, CISPR 11, Class A
ACMA (Australia/New Zealand)
FCC 47CFR, Part 15, Subpart B, Class A (USA)