Introduction
This primer examines the life cycle of a power semiconductor device and the tremendous variety of test and characterization activities and measurement challenges faced by the engineers involved in each stage throughout the cycle. From the early stages of designing a new power device to the point where it’s ready for market, Tektronix’s flexible set of high-power characterization tools are ideal for testing across the entire life cycle of a power device.
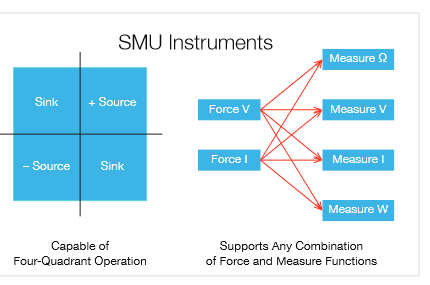
- I-V characterization is a fundamental method of understanding the current versus voltage relationship of power semiconductors. Instruments like source measure units (SMUs) or parameter analyzers show the relationship between the current flowing through a device or circuit and the applied voltage across its terminals.
- For detailed on-state, off-state, or capacitance-voltage characterization, a full parametric curve tracer (PCT) allows both easy data acquisition and detailed parameter extraction.
- For measuring energy loss during device turn-on and turn-off, as well as reverse recovery parameters of a power semiconductor device, a double pulse test system composed of an oscilloscope, power supply, and an AFG are used during device design, validation and for failure analysis.
- Process monitoring, production and reliability testing are critical to ensure commercial usage of a power semiconductor device in critical applications. Multi-channel parallel test systems with automated data evaluation are the tools used in semiconductor fabs.
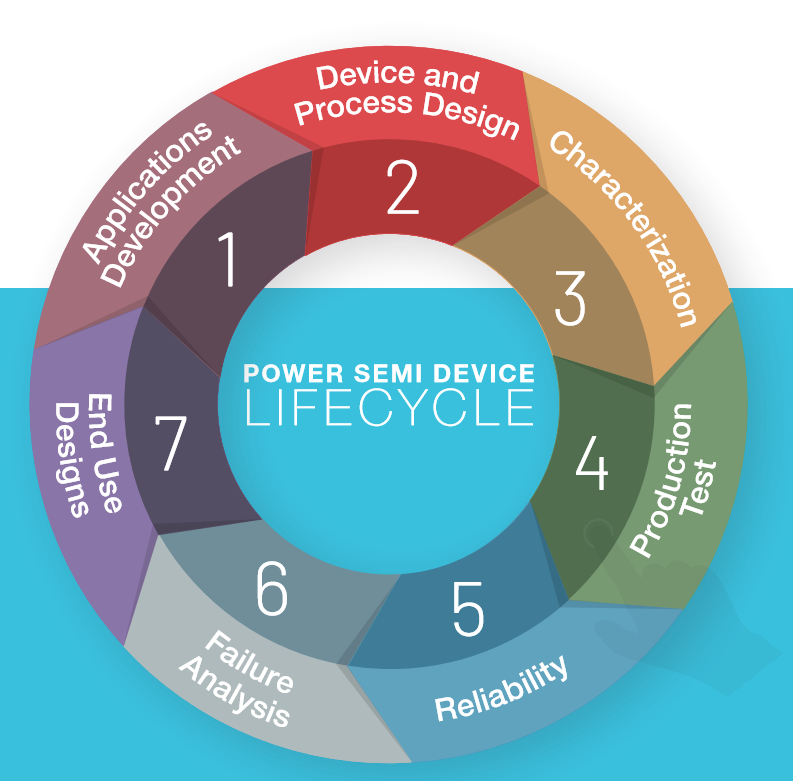
Evaluating New Devices and Designs for New Application Requirements
Advances in wide bandgap semiconductor technology, particularly in the context of power semiconductor testing and high-power semiconductors, are enabling the development of a clean, renewable and reliable energy ecosystem while creating new challenges for engineers. Requirements are changing continuously along with the types of measurements. How can measurements be made quickly and easily without time being wasted to relearn software and instrumentation?
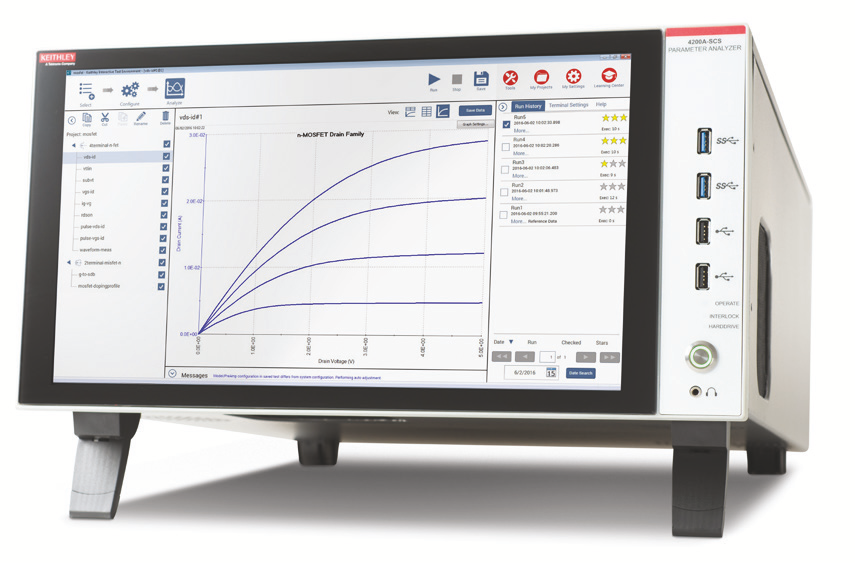
The Keithley 4200A-SCS Parameter Analyzer and the Tektronix 5 and 6 Series MSO oscilloscopes enable the engineer to perform I-V characterization and device analysis. Pinch and zoom enables deeper insights into device performance.
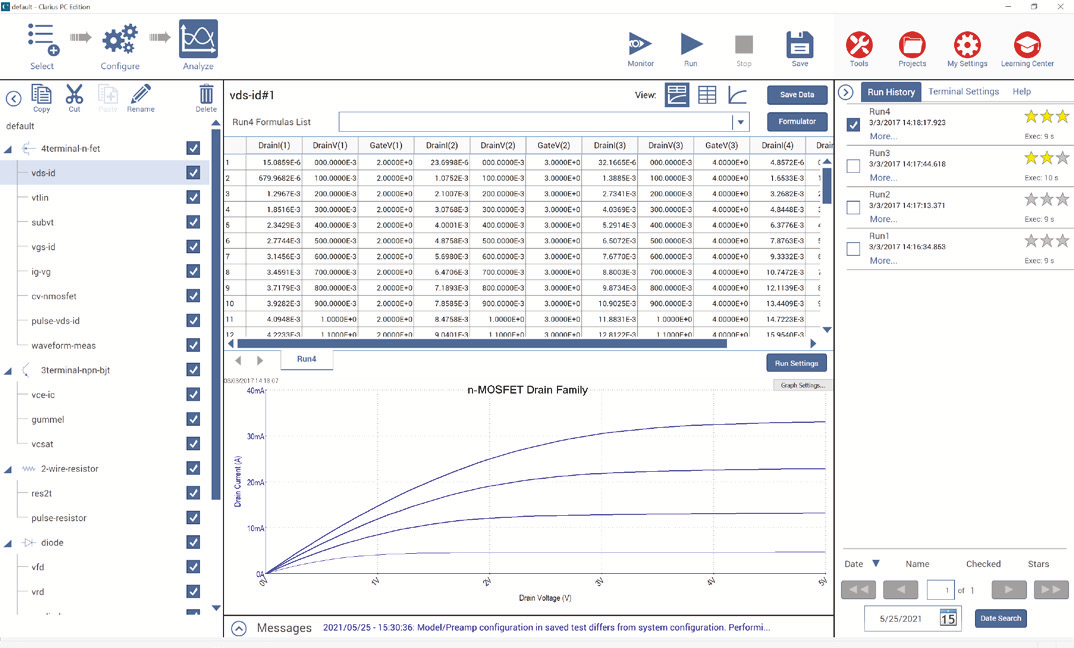
Tektronix offers a wide range of test capabilities, including pulse, DC, and C-V. Our graphical SourceMeter® source measure unit (SMU) instruments simplify the user experience so the engineer can focus on the device and the performance rather than the instrumentation. The Keithley 2461 Graphical High Current Digitizing SMU and the 2470 Graphical High Voltage SourceMeter SMU combined with KickStart I-V Characterization Software simplify the interaction between multiple SMUs to perform current versus voltage (I-V) testing on high power devices, speeding up the time to insight. For more advanced measurement requirements, the Keithley 4200A-SCS Parameter Analyzer reduces the time from setup to running characterization tests by up to 50%, allowing uncompromised measurement and analysis capability. Plus, embedded measurement expertise provides unparalleled test guidance and gives supreme confidence in the resulting measurements.
Breakdown and Leakage Current Measurements on High Voltage Semiconductor Devices Using the Keithley 2470 SourceMeter® Source Measure Unit (SMU) Instrument and KickStart Software
Top 7 Characterization Tests Breakdown and Leakage Current Measurements for MOSFETs
Characterizing Full Performance of New Device Design
To effectively design devices to meet the latest requirements, power device design engineers and process engineers must understand how to tweak the process to produce the desired device performance. There must be confidence that the device models are fairly accurate, and changing a particular process step must produce the necessary change in the device measurement parameter. Therefore, the device engineer must perform preliminary verification of key device parameters.
The combination of a Keithley Parametric Curve Tracer system, the 8020 Probe Station Interface, and ACS-BASIC Edition Software enables the design engineer to run a wide range of tests that must be performed on wafer or a packaged part for DC, CV, and pulsed test. The ACS-BASIC software is designed from the device perspective and includes scores of device libraries and a built-in formulator to quickly relate measurement to device parameters.
Testing Modern Power Semiconductor Devices Requires a Modern Curve Tracer


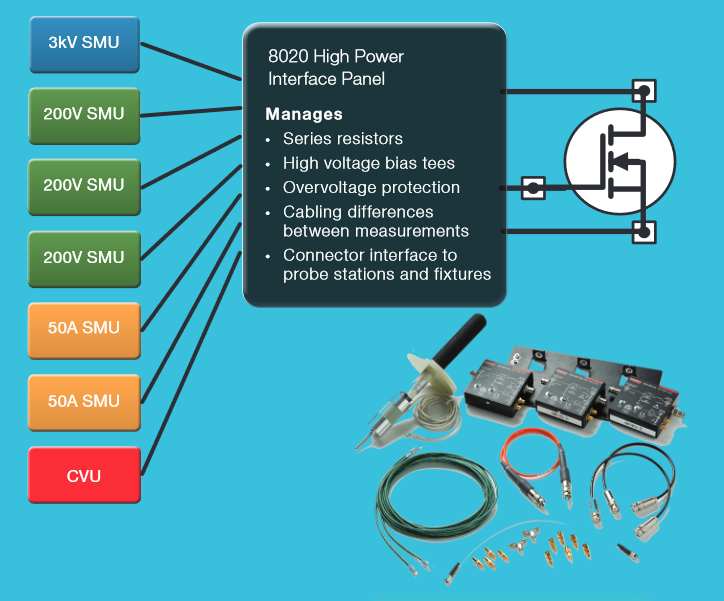


Solving Connection Challenges in On-Wafer Power Semiconductor Device Test
A characterization engineer provides the necessary measurement expertise and understanding of how measurement anomalies can impact non-targeted areas of device performance. It’s imperative to get results fast to enable multiple iterations with device or process engineers and quickly convert measurements to device parameters.
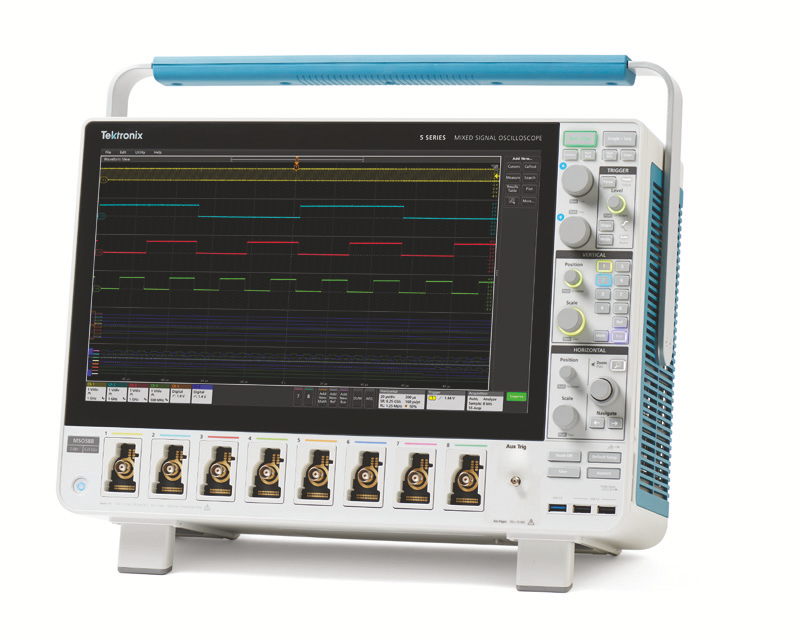
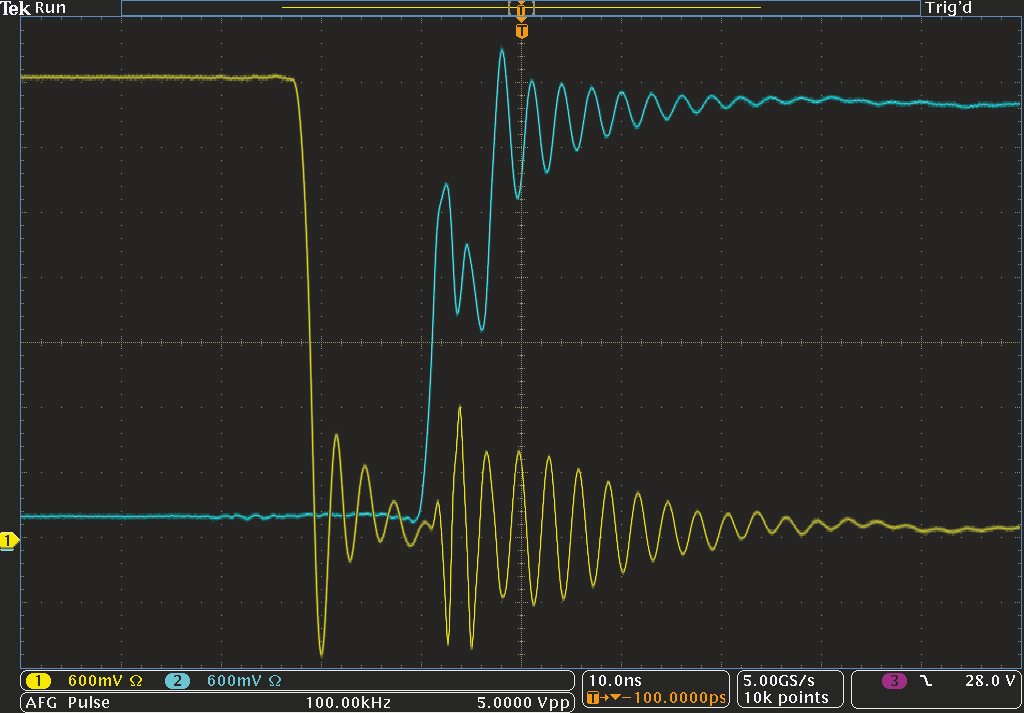
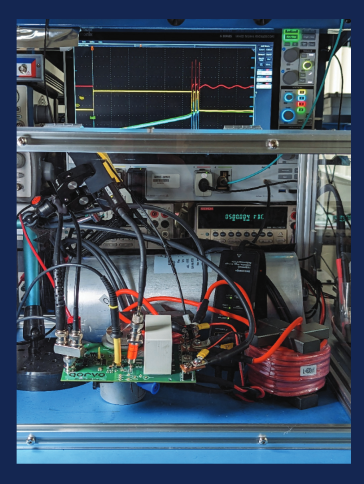
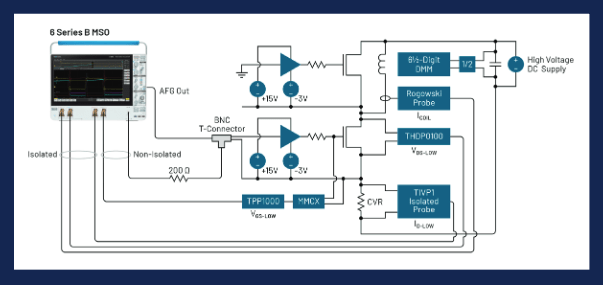
Minimizing switching losses continues to be a major challenge for power device engineers working on SiC and GaN devices. The standard test method for measuring switching parameters and evaluating the dynamic behavior of Si, SiC and GaN MOSFETs and IGBTs is the double pulse test (DPT). Double pulse testing can be used to measure energy loss during device turn-on and turn-off, as well as reverse recovery parameters.


Double Pulse Testing Power Semiconductor Devices with a 5 or 6 Series MSO with Built-in Arbitrary Function Generator


Preparing the Device for Production
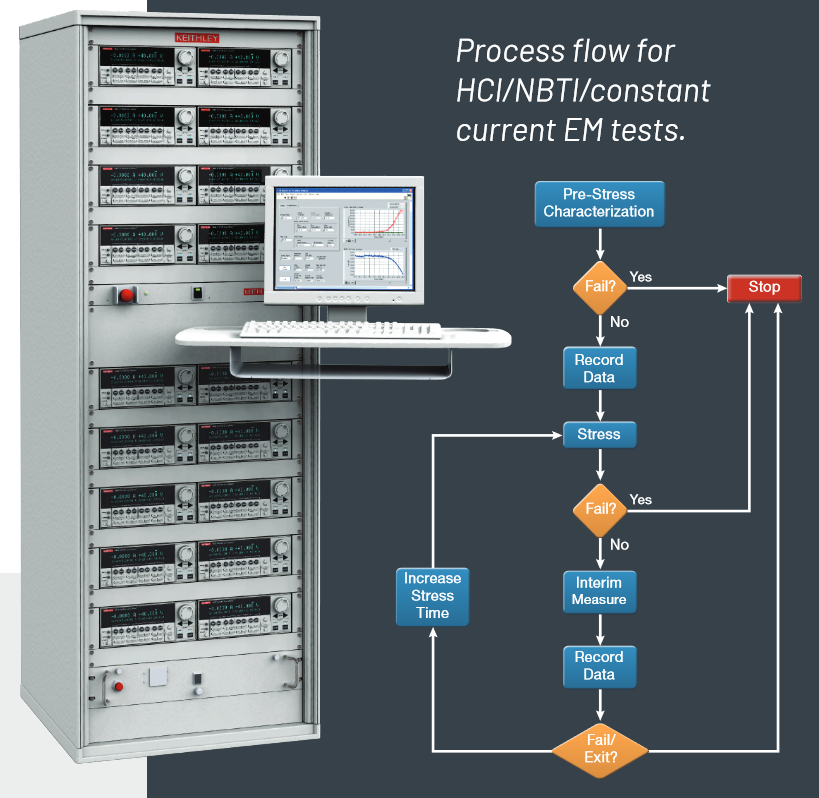
To properly prepare a device for production, the production test engineers must prove if the device can be produced reliably. Measurements must be gathered for statistical setting of device specifications, and test times must be optimized to meet required production throughput.
Multi-functional instruments offer the best way to obtain measurements quickly with minimal connection changes and switching.
SMU instruments are multi-functional instruments that are proven for use in semiconductor applications. SMU instruments with Test Script Processor (TSP®) technology are primed for throughput because of their tight synchronization, built-in processors for complex operations and decision-making performed within the instrument, thus minimizing communication times. These SMU instruments are used in PCT configurations for interactive testing and also in S500 Parametric Test Systems for automated production testing. Automated Characterization Suite (ACS) Software combines advanced semiconductor test capabilities along with prober control, data reporting and statistics.


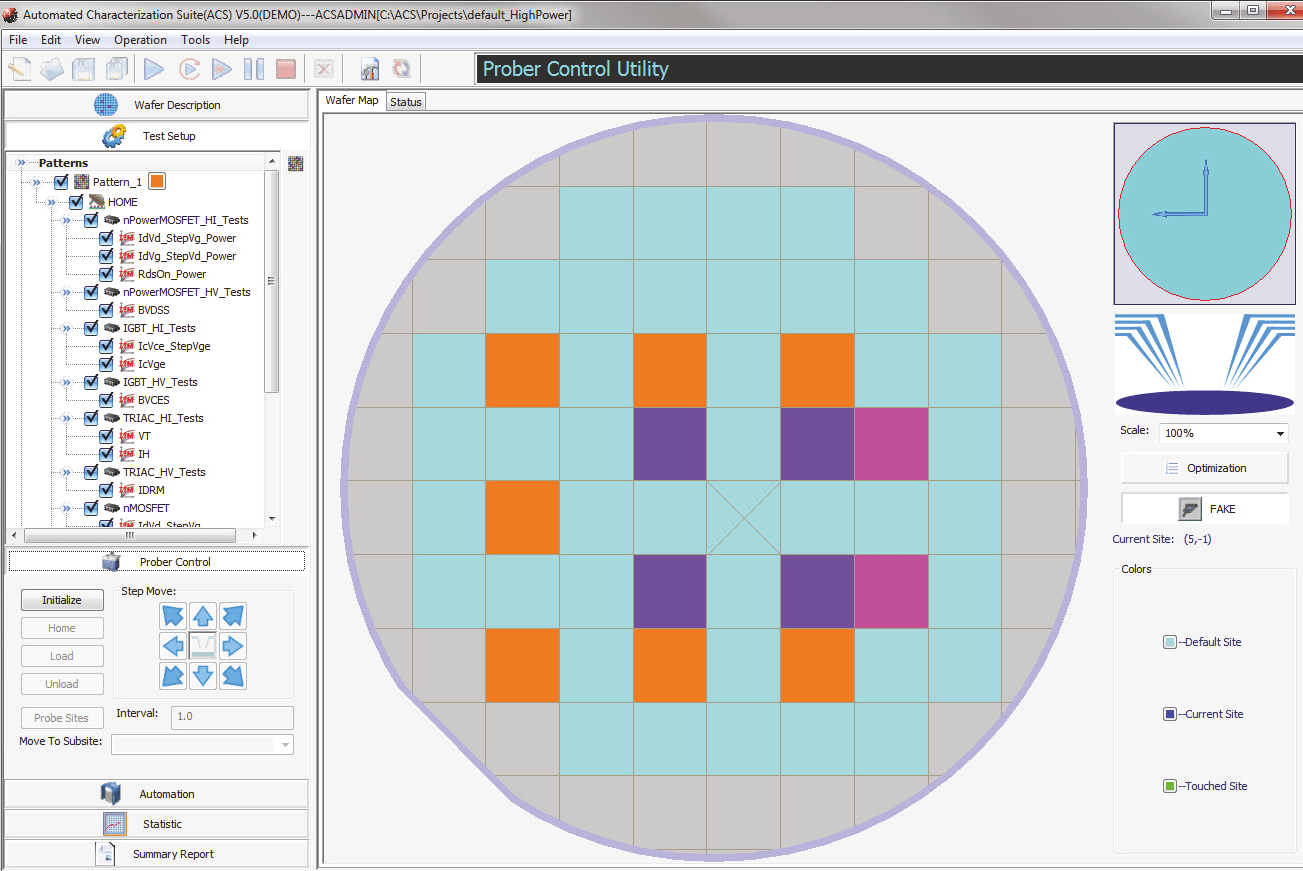
ACS maps devices and tests to sites and subsites, eliminating the need to duplicate each test for each subsite and reducing test development time.
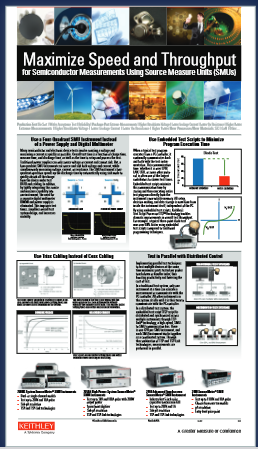
Maximize Speed and Throughput for Semiconductor Measurements Using Source Measure Unit (SMU) Instruments

Meeting Reliability Standards for Commercial Use
To conclude that a device meets reliability standards for commercial use, reliability test engineers have several responsibilities:
- Determining if a device will survive environmental stresses and continue to meet specifications
- Answering customer questions about device lifetime (MTBF, MTTF)
- Providing key insight into device fit for certain high reliability applications (mil/aero,automotive, etc.)
Creating statistically relevant results requires sufficient sample sizes of the test devices. The nature of stress-measure cycling over many devices necessitates multi-channel parallel test with automated data evaluation.
S500 Integrated Test Systems are reliability test systems that can be custom built to accommodate from small to large number of devices. ACS features stress measure loop cycling with integrated decision making. Keithley also provides a wide range of power supply and SMU instrument solutions to permit simultaneous power and testing of any number of devices.
Learn more from these Application Resources
Optimizing Reliability Testing of Power Semiconductor Devices and Modules with Keithley SMU Instruments and Switch Systems

VDS Ramp and HTRB Reliability Testing of High Power Semiconductor Devices with Automated Characterization Suite (ACS) Software
New High Power Semiconductor Devices are Pushing Instrumentation to Extremes

Implementing the Device in Actual Designs
Once a device is validated, it’s ready for commercial use. Those who purchase devices must verify that the device is within tolerance for a particular application to ensure that the expected power efficiency gains will be achieved in the end product. As the device matures and becomes available from multiple suppliers, power device consumers want to quickly inspect incoming devices in order to identify and eliminate counterfeit devices to avoid potential failures in the end product.
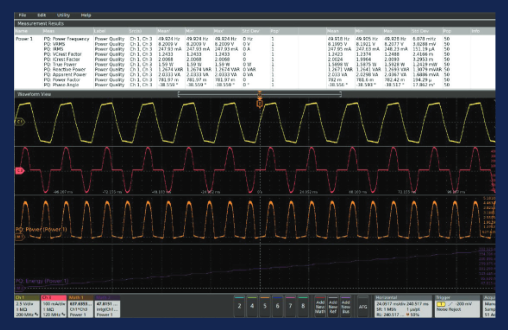
Tektronix and Keithley offer a wide variety of power supply and source measure unit solutions to power basic circuit boards. Keithley’s Parametric Curve Tracer (PCT) Configurations and ACS Basic Edition Software include a large library of power device tests so incoming inspection test on individual device performance can be quickly verified. Additionally, Tektronix’s oscilloscopes with optional power analysis modules enable quick and accurate analysis of switching loss, harmonics, and safe operating area. Choose from a wide variety of high voltage, current, and differential probes to partner with an oscilloscope.


Today’s power supply designers are faced with increasing pressure to achieve power conversion efficiencies of 90% and even higher.
Failure Analysis of Devices and Actual Designs
Failure analysis engineers must determine whether a failure has been caused by end-product use or by a design flaw that was previously overlooked. Once this determination has been made, design and process engineering must be made aware of the cause of the failure so that either process or design changes can be implemented to prevent future failures.
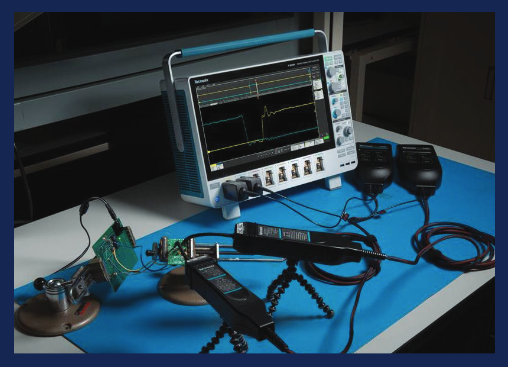
It’s important that basic device specifications, both static and dynamic, can be measured quickly. The end use application is mimicked in an effort to reproduce the failure. Keithley Parametric Curve Tracer Configurations feature trace mode, which provides quick device analysis. Tektronix oscilloscopes enable the engineer to diagnose failures resulting from ground loops, ESD and component failure on circuit boards.

Learn more from our Experts | Download these Application Resources
Troubleshooting ESD Failures Using an Oscilloscope
Measuring Low Resistance Devices with High Current Using the 2460 SourceMeter SMU Instrument

Evaluating Oxide Reliability Using V-Ramp and J-Ramp Techniques
EMI Troubleshooting with the Latest-Generation Oscilloscopes
Find more valuable resources at TEK.COM
Copyright © Tektronix. All rights reserved. Tektronix products are covered by U.S. and foreign patents, issued and pending. Information in this publication supersedes that in all previously published material. Specification and price change privileges reserved. TEKTRONIX and TEK are registered trademarks of Tektronix, Inc. All other trade names referenced are the service marks, trademarks or registered trademarks of their respective companies.
01/2024 1KW-60127-2